
Will Bitcoin Chart a New All-Time High Before the Upcoming Halving? (BTC Price Analysis)

Bitcoin’s price has been going through a consolidation phase over the past month, failing to continue its rally higher than $75K. Yet, things might be about to change soon.
Technical Analysis
By TradingRage
The Daily Chart
On the daily chart, the price has been forming a large triangle pattern around the $70K mark. Depending on the direction of the potential breakout, these patterns can signal a reversal or continuation of the trend.
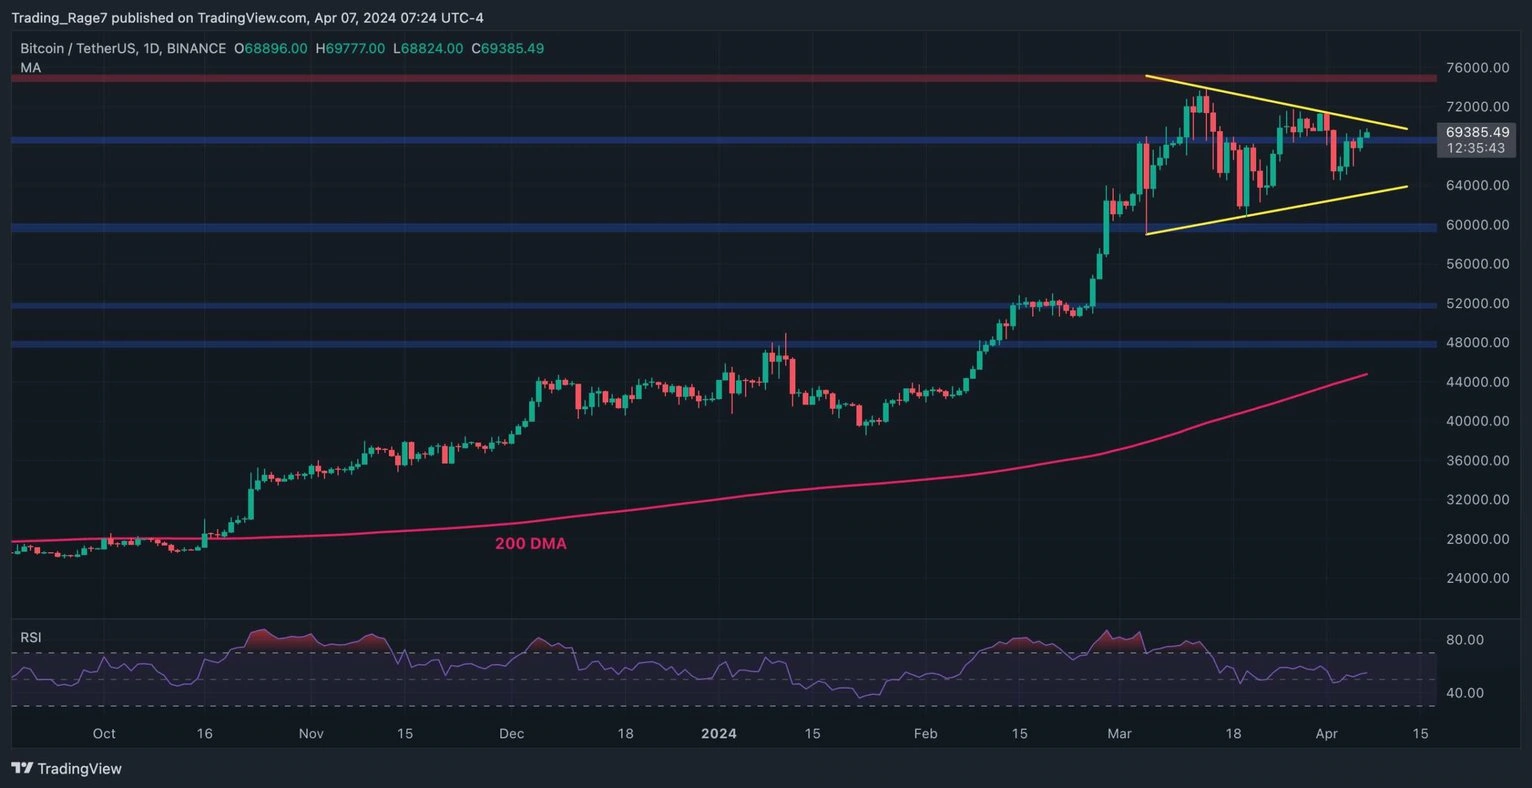
Currently, the market has reclaimed the $68K level and is moving toward the higher boundary of the pattern. If a bullish breakout occurs, a rally toward higher prices and a new all-time high can be expected in the short term.
The 4-Hour Chart
Looking at the 4-hour chart, It is evident that the price has rebounded from the $64K level and pushed above $68K. The market is approaching the higher boundary of the triangle pattern, and its reaction to it would determine whether a new all-time high can be expected in the coming weeks or if there is still more consolidation on the horizon.
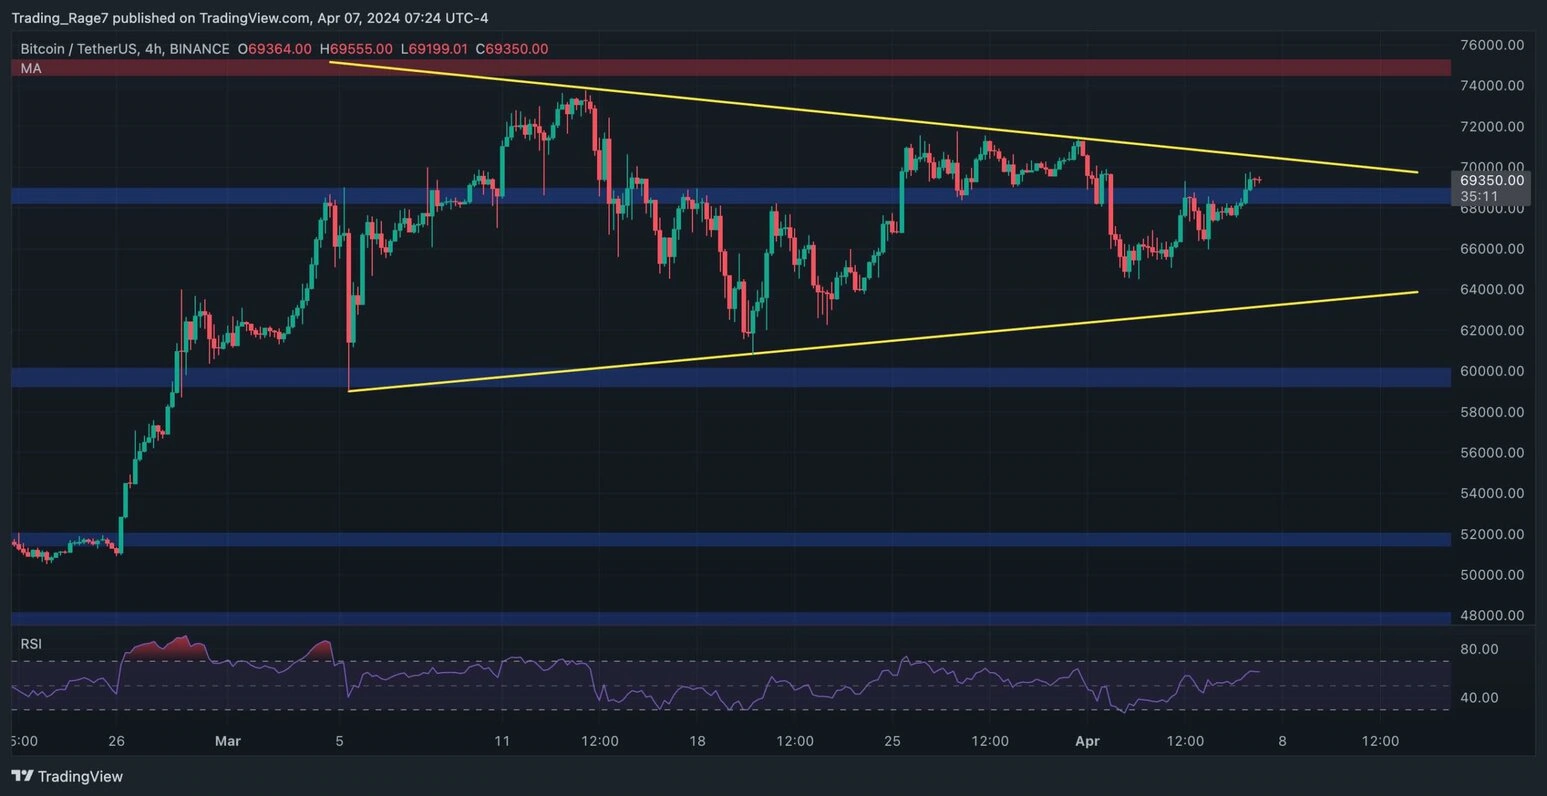
The Relative Strength Index also shows values above 50%, indicating that the momentum favors a bullish continuation.
On-Chain Analysis
By TradingRage
Short-Term Holder SOPR
A prominent reason for corrections during the bull cycles is profit realization by market participants. After Bitcoin made a new all-time high, many investors sold some of their coins to realize profits.
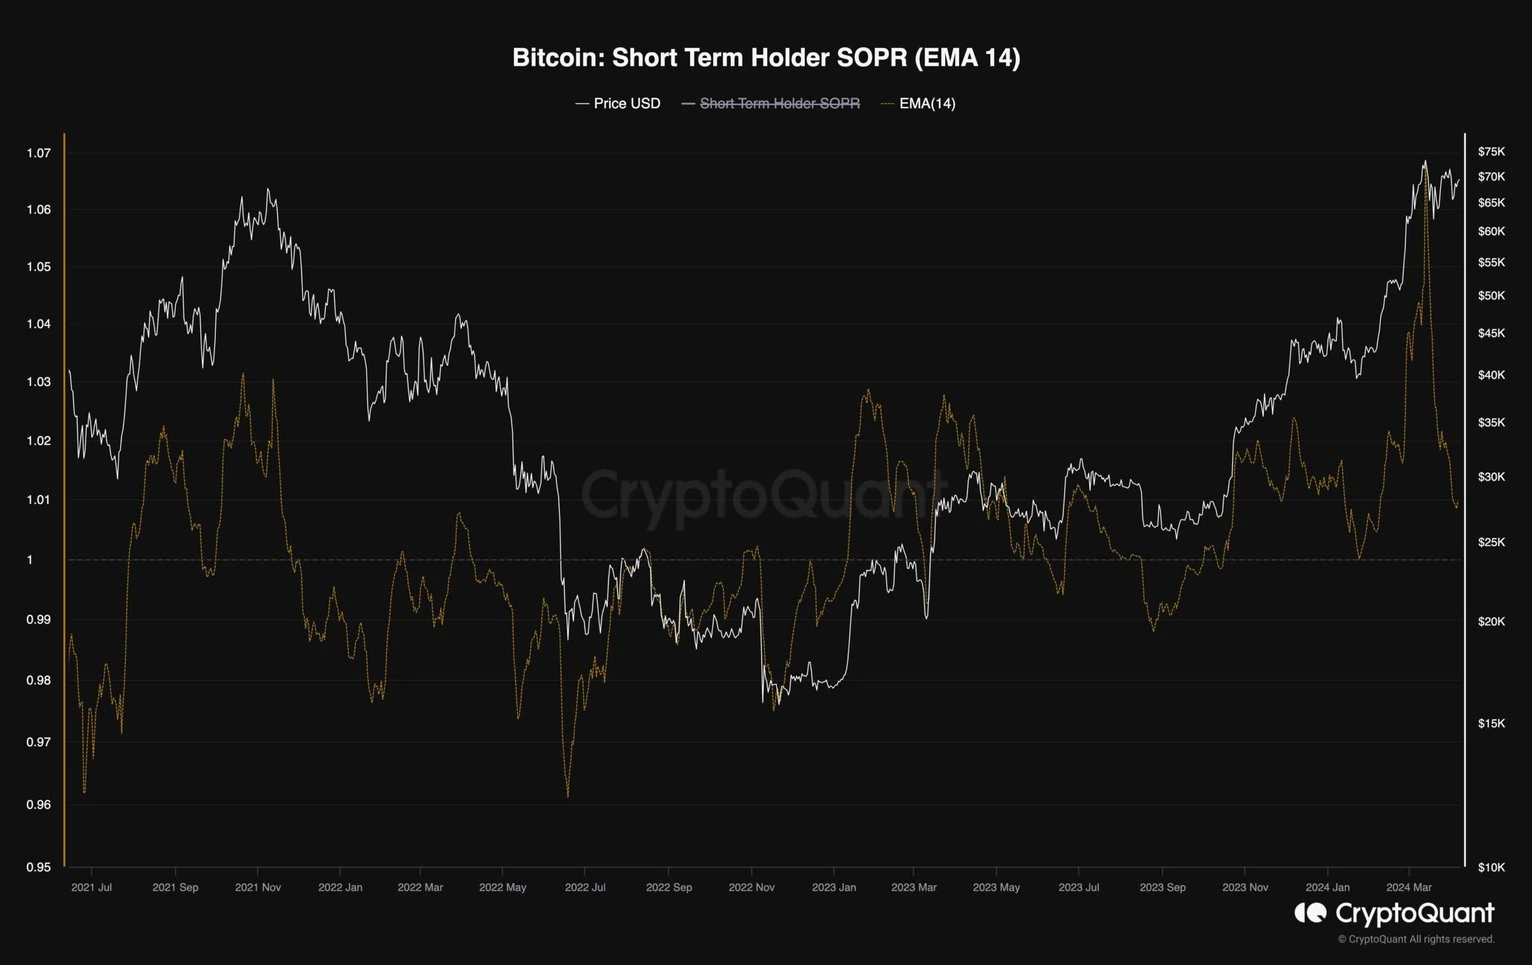
This selling pressure is one of the main factors leading to the recent halt in price rally.
This chart demonstrates the short-term holder Spent Ouptut Profit Ratio (SOPR), which measures the ratio of profits realized by holders who have held their coins for less than 155 days.
As the chart suggests, the SOPR metric spiked significantly but rapidly dropped during the consolidation. This massive decline hints that the profit realization phase is mostly over, and the market might be ready to begin a new bullish wave.
Disclaimer: The content of this article solely reflects the author's opinion and does not represent the platform in any capacity. This article is not intended to serve as a reference for making investment decisions.
You may also like
Altcoin SUI Needs to Break Out Above $1.42 to Maintain Bullish Momentum and Open Doors to $10 – $20 ATHs
Ellison pledges an additional 67 million Oracle (ORCL.US) shares as loan collateral to support Paramount Sky (PSKY.US) in the $100 billion Warner acquisition deal
As one of the key figures driving Paramount's acquisition deal with Warner Bros. Discovery, Oracle Executive Chairman and CTO Lawrence Ellison now holds 67 million more Oracle shares as collateral for personal loans compared to a year ago.
What signal? The company owned by Trump's son invests $10 million in drone defense service provider Draganfly (DPRO.US)
Unusual Machines, supported by Donald Trump Jr., and a US asset management company have invested $10 million in the Canadian company Draganfly.
Crypto prices
More


