
ETH Slides Below $3.5K But Bullish Presence Remains Strong (Ethereum Price Analysis)

Ethereum’s price has undergone an extensive phase of sideways consolidation subsequent to a decline toward the critical support level of $3K.
Despite this, the cryptocurrency seems confined within a range between $3K and $3.7K, and it’s unlikely that volatility will pick up unless it manages to break out in either direction.
Technical Analysis
By Shayan
The Daily Chart
A comprehensive analysis of the daily chart reveals Ethereum’s prolonged sideways consolidation after finding substantial support around the $3K threshold. This zone aligns with significant Fibonacci retracement levels ranging between 0.5 ($3190) and 0.618 ($2972) alongside the pivotal 100-day moving average at $2972. This confluence of support levels spurred a rebound in ETH’s price, pushing it towards the upper boundary of the range at $3.7K.
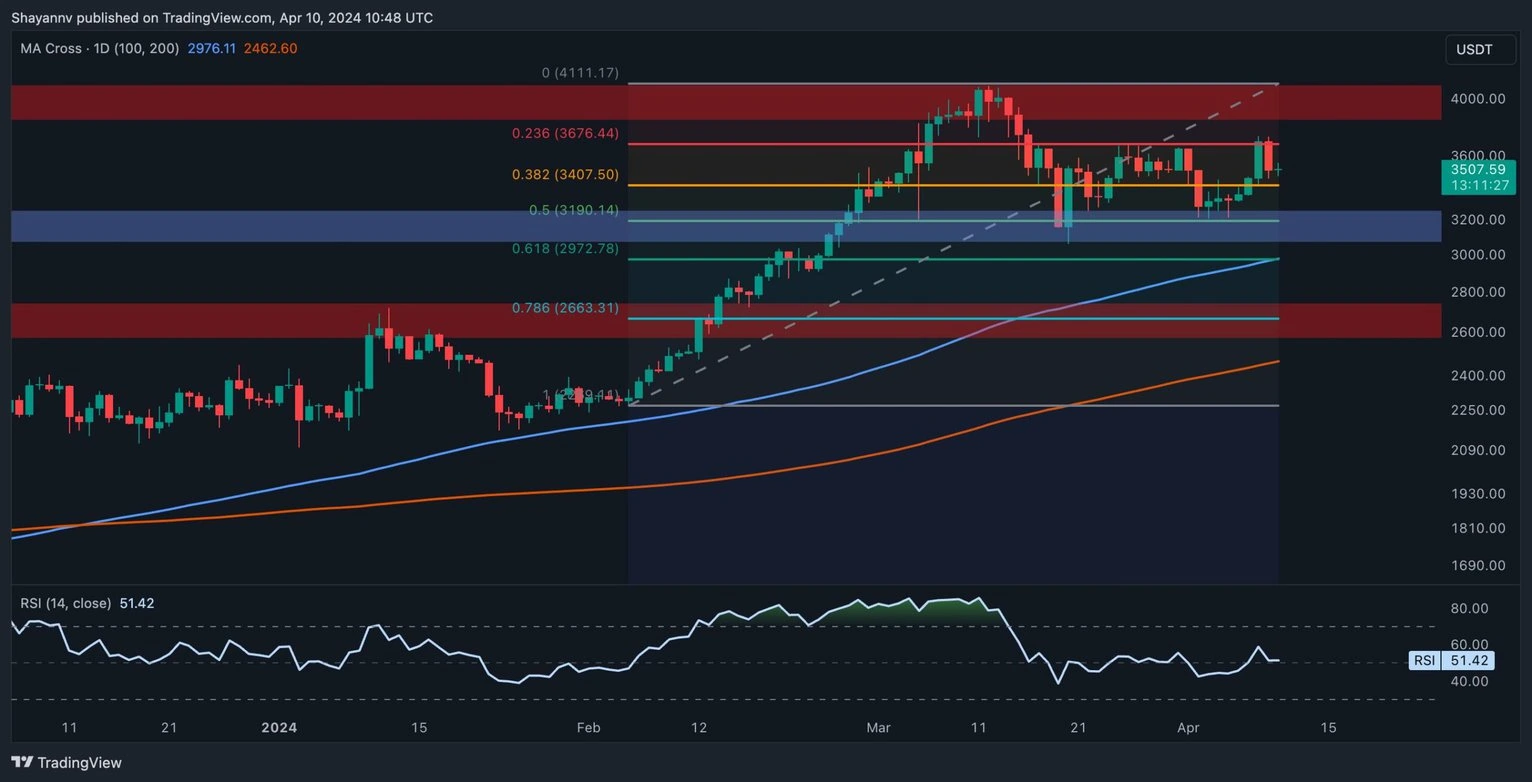
However, recent price action has encountered resistance near the upper boundary of the range, suggesting the presence of sellers at this critical juncture.
Nevertheless, Ethereum remains in a phase of sideways consolidation, with market participants anticipating a bullish revival aimed at breaking above this crucial price range.
The 4-Hour Chart
A closer examination of the 4-hour chart reveals the formation of a sideways wedge pattern during a period of corrective retracements. Typically, such patterns indicate a potential continuation of the bullish trend upon breakout from the upper boundary.
Despite this, Ethereum experienced significant buying pressure in the vicinity of the noteworthy $3K support region, resulting in a renewed bullish momentum that breached the upper boundary of the wedge.
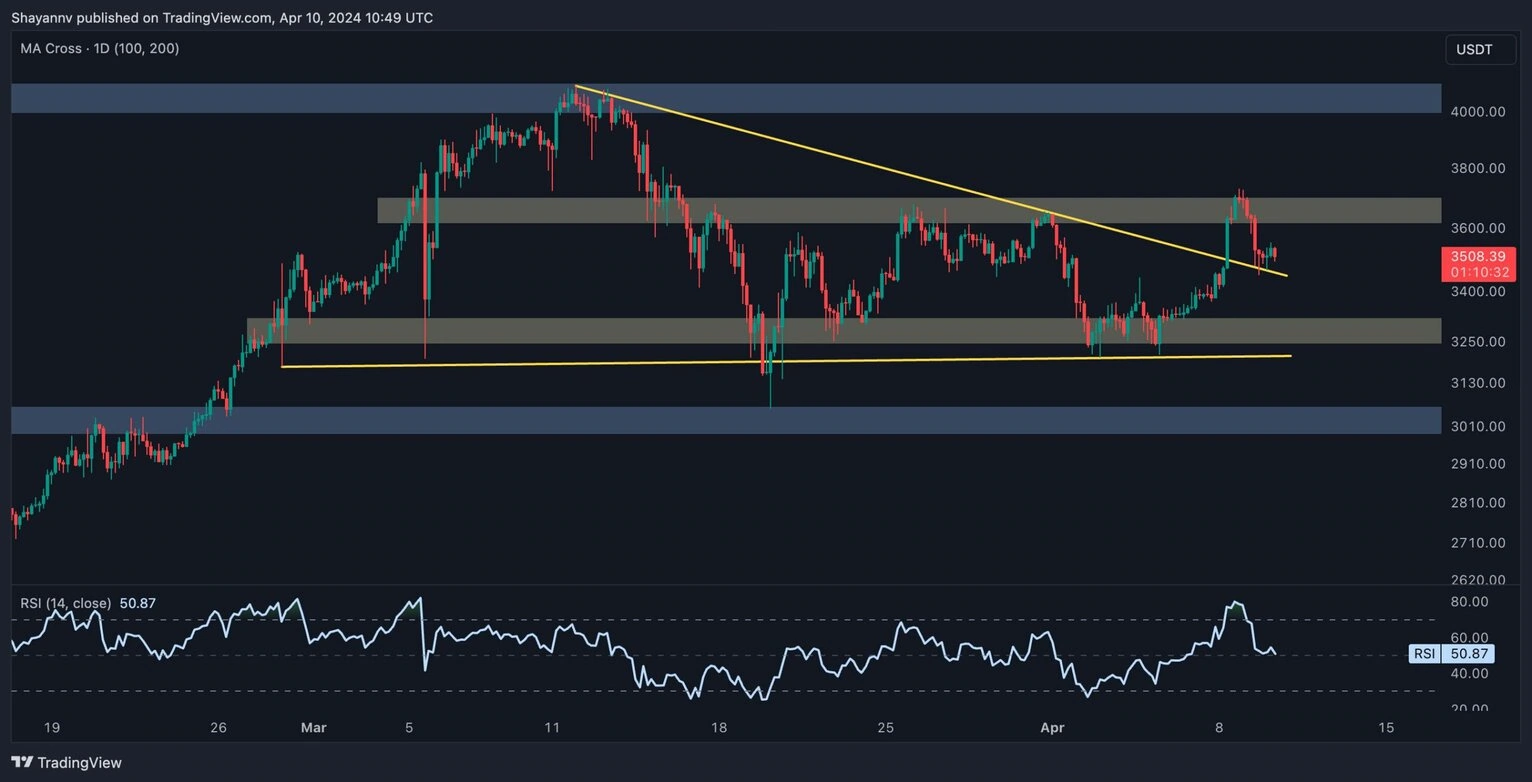
This price action underscores the dominance of buyers in the market. However, upon reaching the resistance level of $3.7K, Ethereum faced rejection, triggering a slight retracement.
Currently, following this retracement, the price has returned to the broken level of the wedge, potentially completing a pullback. Should this pullback prove successful, Ethereum’s price is poised for another upswing, targeting the $3.7K threshold. Conversely, the possibility of a bearish retracement, with the next support level at $3.2K, cannot be ruled out.
On-chain Analysis
By Shayan
While Ethereum’s price has been showing signs of rebound, it would be beneficial to determine whether this is a result of spot buying pressure or leveraged futures positions.
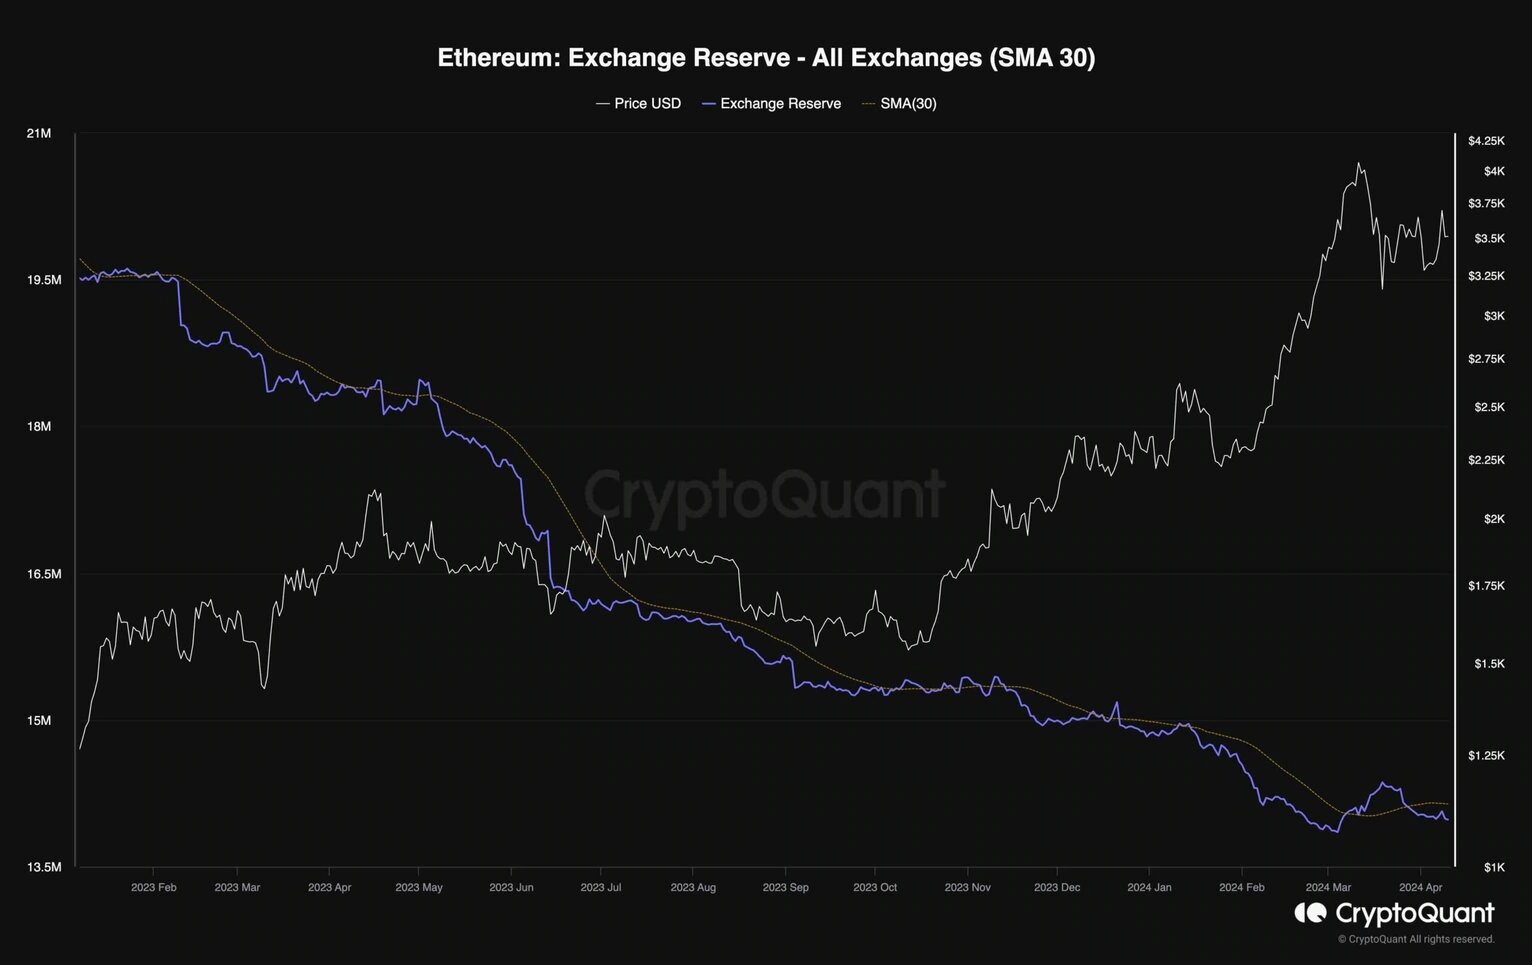
The following chart demonstrates the exchange reserve metric, which measures the amount of ETH held on exchange wallets.
It is evident that after a sharp increase above the 30-day moving average a few weeks ago, the exchange reserve metric has fallen below the MA once again. This indicates that investors have been withdrawing ETH from exchanges, which is a sign of spot buying pressure. Therefore, the spot market demand is playing a major role in a potential rally higher, which could result in a more sustainable uptrend.
Disclaimer: The content of this article solely reflects the author's opinion and does not represent the platform in any capacity. This article is not intended to serve as a reference for making investment decisions.
You may also like
The "debt black hole" behind the AI boom: $1.2 trillion external financing may be needed in the next five years
The rapid surge of AI is creating an unprecedented "debt black hole": according to Bank of America estimates, total capital expenditure for building AI data centers between 2025 and 2030 will reach as much as $5 trillion, with external financing needs of core cloud giants alone reaching $1.2 trillion to $1.5 trillion. Free cash flow is already running low for giants such as Amazon and Meta, while Nvidia and Broadcom have quietly taken on the role of "implicit guarantors"—marking the beginning of a capital gamble that is set to reshape global credit markets.
Analyst Makes Bold Prediction: Micron (MU.US) Expected to Surpass Microsoft (MSFT.US) in Fiscal Year 2027 Profit; Memory Prices Are the Key Factor
Is Micron (MU.US) expected to earn a net profit of $35 billion in a quarter, surpassing Microsoft's (MSFT.US) profits?
Warning Signs of US Stock Market Crash Reappear as in 2018 and 2022? Fed Tightening and US Treasury Supply Hit Amid Worsening Market Breadth, Liquidity Crisis May Be Approaching
Liquidity pressures may not yet be apparent on the surface of the market, but as market breadth in both stock and bond markets continues to deteriorate, these pressures are steadily accumulating internally.
X Finance Bull highlights $3,300 XRP price model filed with SEC
Crypto prices
More


