

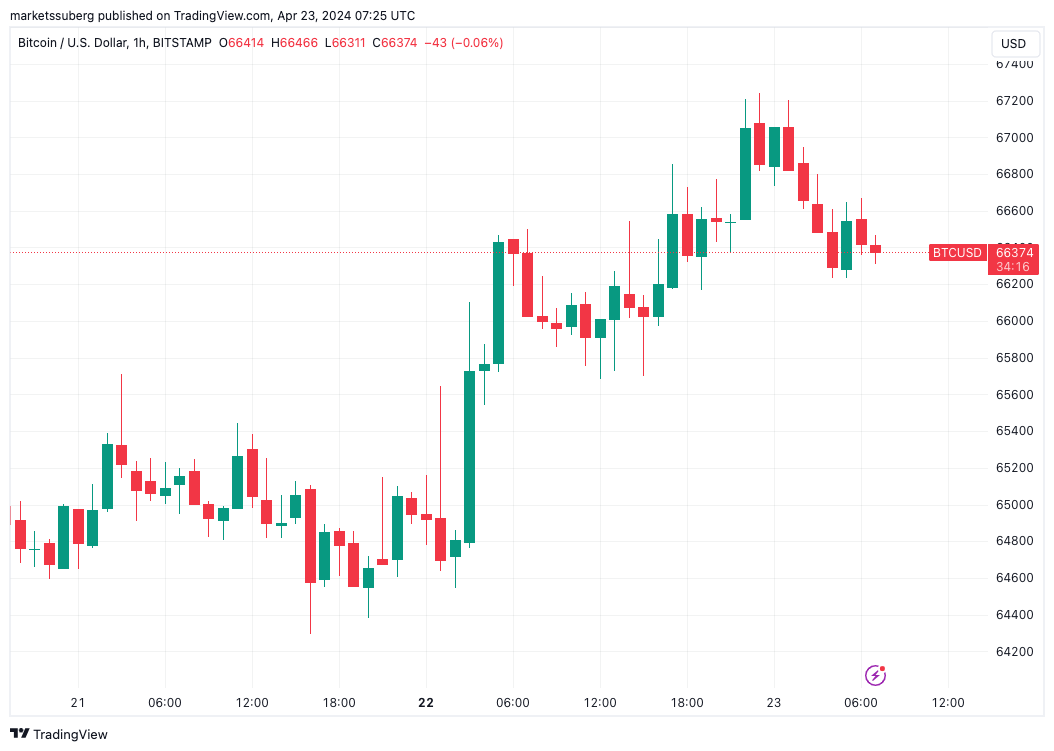
Bitcoin ( BTC ) stuck near $66,000 on April 23 as waiting sellers kept BTC price action firmly in check.
Bitcoin Bollinger Bands hit level that saw BTC price squeeze past $50K
By:William Suberg
The Bitcoin volatility indicator suggests that BTC price action is due for a breakout as it returns to levels last seen in mid-February.
Bitget offers one-stop trading for cryptocurrencies, stocks, and gold. Trade now!
A welcome pack worth 6200 USDT for new users! Sign up now!
BTC/USD 1-hour chart. Source: TradingView
Liquidity keeps BTC price in tight range
Data from Cointelegraph markets Pro and TradingView revealed an ongoing new trading range in place since after the weekly close.
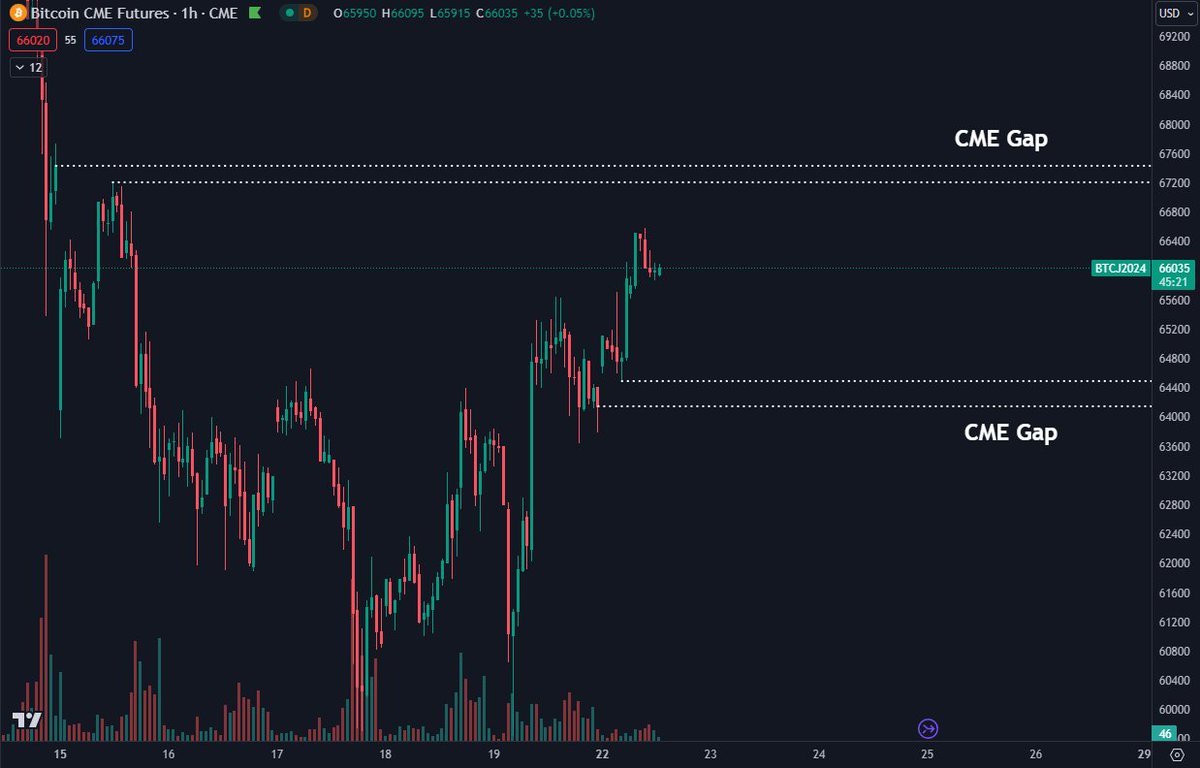
While overall higher than last week, BTC/USD offered little inspiration to bulls — an overnight rally to $67,200 failed to close a nearby CME Group Bitcoin futures gap .
This, combined with another gap lower at $64,400, form near-term BTC price targets, which have yet to be hit.
Analyzing the current status quo, popular trader Marco Johanning identified $66,700 as the “key level” for Bitcoin to flip to support going forward.
“Looking at the range, BTC reclaimed midrange and then sent from there,” he wrote in part of a post on X (formerly Twitter) on the day.
“However, it couldn't flip the next level at 66.7k so far. That's the key level for today.”
BTC/USD chart with CME futures gaps. Source: Daan Crypto Trades/X
Johanning saw two options based on the market’s treatment of the $66,700 mark: “a) Flip 66.7k -> head towards the old trendline and range high,” and “b) Get rejected at 66.7k -> fall back to midrange, potentially with a wick below to close the CME gap.”
“Both scenarios assume that the short-term trend will continue, and we will move towards the range high,” he added.
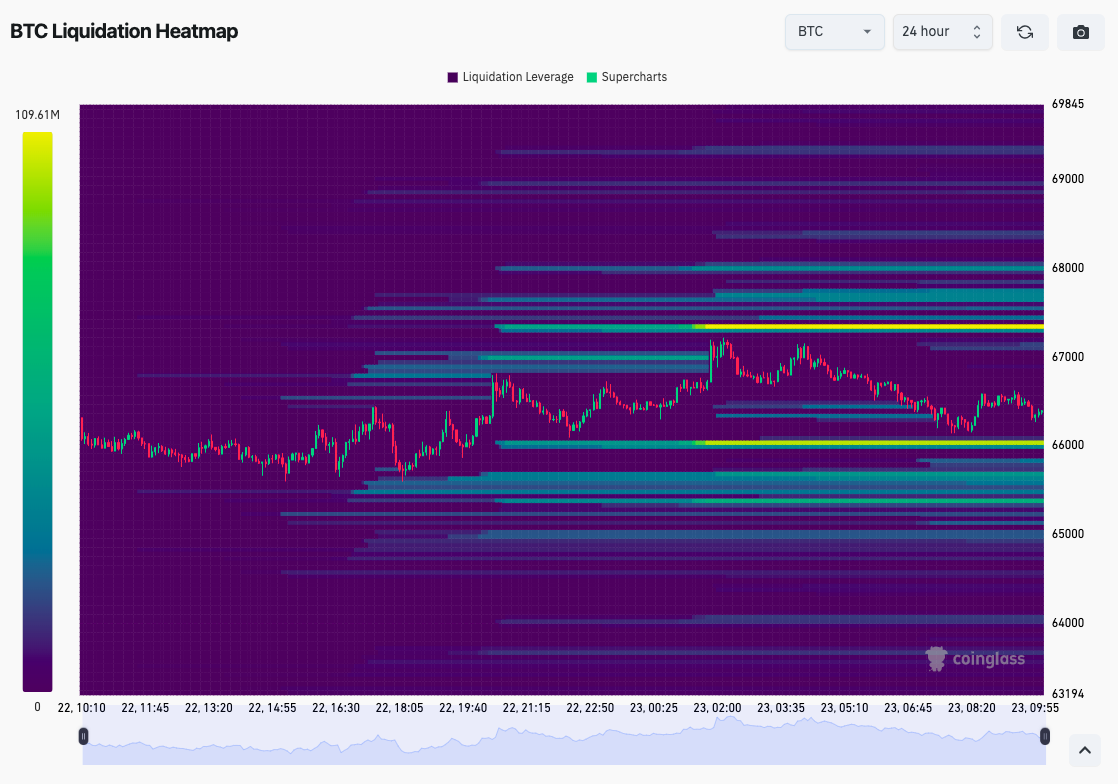
The post referenced the current liquidity landscape on exchange order books, which continued to show bids and asks tightly wound around spot price.
Data from monitoring resource CoinGlass confirmed on the day that $66,000 and $67,350 formed the biggest support and resistance levels, respectively.
BTC liquidity heatmap (screenshot). Source: CoinGlass
Bollinger Bands reach February breakout zone
Anticipation of a larger BTC price move, meanwhile, lingered in the background.
Related: BTC trades at ‘deep discount’ after halving — 5 things to know in Bitcoin this week
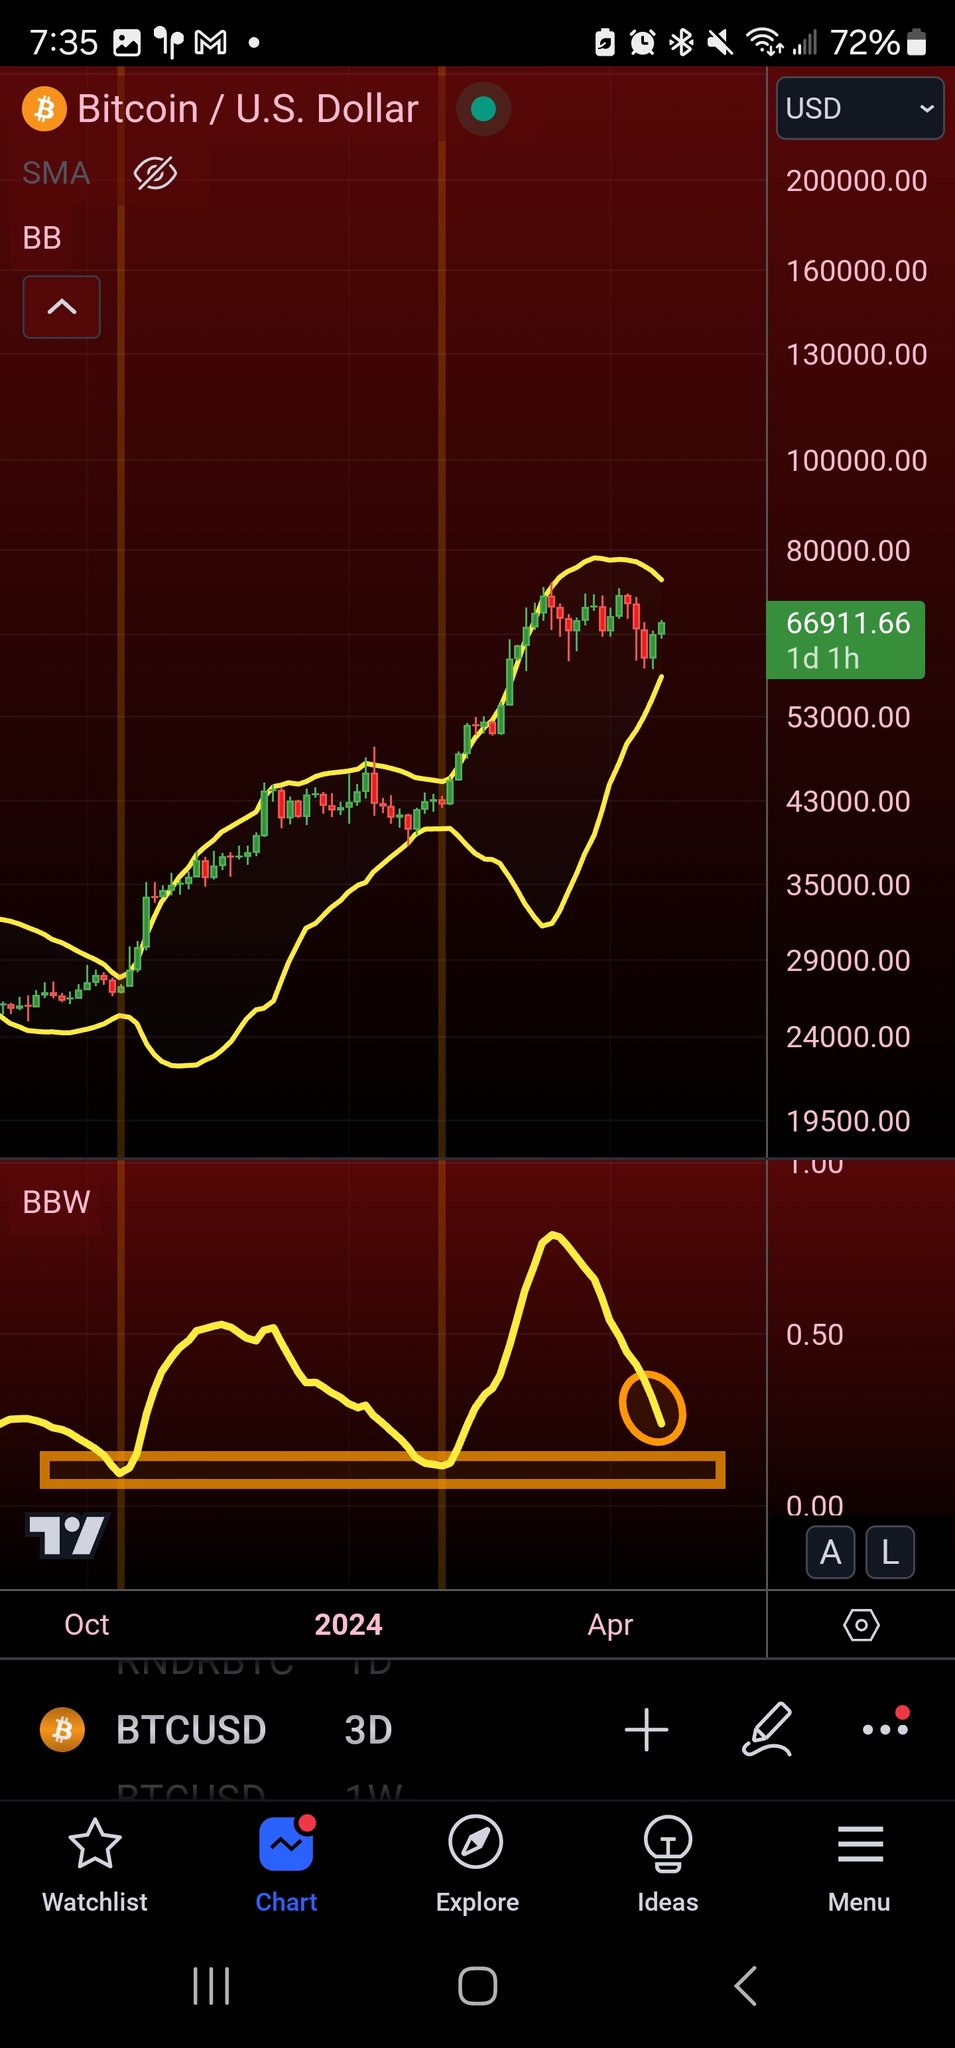
For popular trader and analyst Matthew Hyland, changing Bollinger Bands conditions on 3-day timeframes indicated that a range breakout — either up or down — should come soon enough.
The width of the Bands, a classic volatility indicator , is currently the narrowest since mid-February, when BTC/USD last traded below $50,000.
At the time, Cointelegraph reported on the implications of Bollinger Bands behavior for BTC price action, with analysis seeing an upside “squeeze,” which ultimately became reality .
BTC/USD chart with Bollinger Bands, Bollinger Bands width data. Source: Matthew Hyland/X
This article does not contain investment advice or recommendations. Every investment and trading move involves risk, and readers should conduct their own research when making a decision.
0
0
Disclaimer: The content of this article solely reflects the author's opinion and does not represent the platform in any capacity. This article is not intended to serve as a reference for making investment decisions.
Understand the market, then trade.
Bitget offers one-stop trading for cryptocurrencies, stocks, and gold.
Trade now!
You may also like
United States Dollar Index holds gains above 100.00 as Fed signals further tightening
FXStreet•2026/09/17 02:54
Euro weakens to near 1.1450 as Fed raises rate for first time in three years
FXStreet•2026/09/17 02:48
Best Crypto Presale List 2026 for Long-Term Holders: Utility Depth Beyond the Token Sale
BitcoinSistemi•2026/09/17 02:39
Classic never goes out of style! Berkshire plans to increase holdings in Japan's five major trading companies, "Strong cash flow + dividends + buybacks" firmly lock in long-term capital
According to Masahiro Okafuji, Chairman of the Japan Foreign Trade Association, Berkshire Hathaway is considering increasing its stake in Japanese trading companies. Berkshire Hathaway holds more than 10% of shares in Mitsubishi Corporation, Sumitomo Corporation, Mitsui & Co., Marubeni Corporation, and Itochu Corporation, and may further increase its stakes in these companies.
智通财经•2026/09/17 02:26

Crypto prices
More
Bitcoin
BTC
$76,284.02
+0.55%

Ethereum
ETH
$2,427.95
+1.06%

Tether USDt
USDT
$0.9991
-0.01%

BNB
BNB
$724.37
+1.46%

XRP
XRP
$1.3
+0.71%

USDC
USDC
$0.9999
+0.00%

Solana
SOL
$99.4
+2.18%

TRON
TRX
$0.3356
+0.85%

Zcash
ZEC
$1,376.78
+22.50%

Hyperliquid
HYPE
$79.29
+2.27%
How to buy BTC
Bitget lists BTC – Buy or sell BTC quickly on Bitget!
Trade now
Become a trader now?A welcome pack worth 6200 USDT for new users!
Sign up now