
Shiba Inu (SHIB) Price Shows Signs of Exhaustion After 19% Weekly Gains

SHIB price trades at $0.000028, showing 19.01% weekly gains despite technical indicators suggesting a potential short-term correction ahead.
Shiba Inu (SHIB) price continues to show high volatility amid mixed technical signals. With a 19.01% gain in the past seven days, SHIB maintains its position as the second-largest meme coin by market cap, trailing only Dogecoin (DOGE).
The coin’s technicals paint a complex picture, with RSI cooling off from overbought levels and decreasing whale accumulation suggesting potential short-term corrections. However, strong EMA indicators still leave room for significant upside potential, making SHIB’s next price move particularly crucial for traders.
SHIB RSI Is Down From Overbought
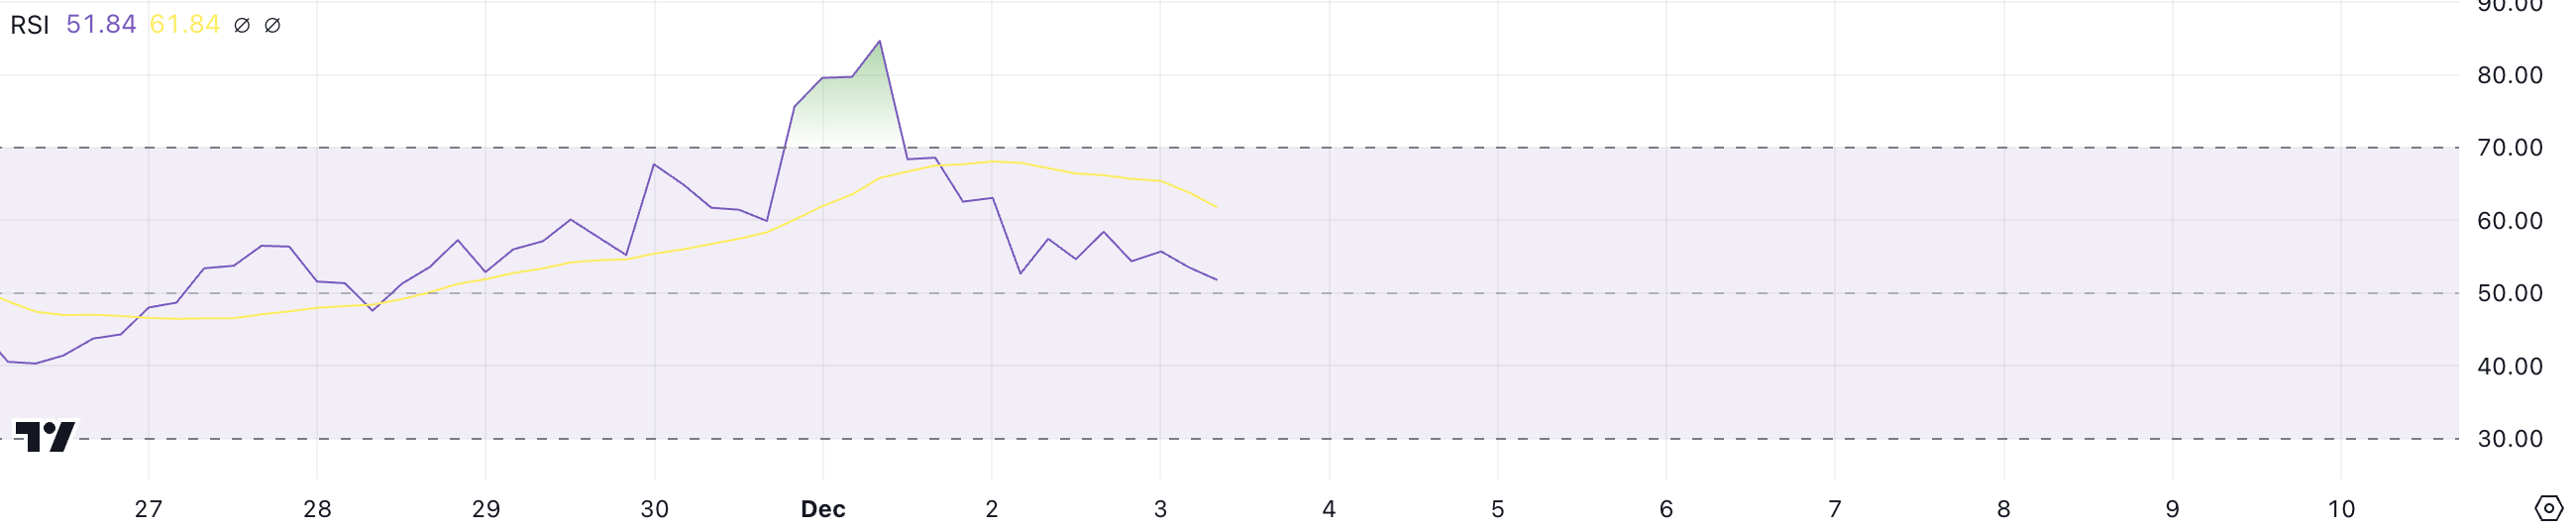
SHIB’s RSI (Relative Strength Index) decline from 85 to 51.8 indicates a significant cooling off in buying momentum. When RSI was at 85, it showed SHIB was heavily overbought, with buyers dominating the market.
The current RSI of 51.8 suggests a more balanced market, where buying and selling pressures have equalized following a period of traders’ profit-taking.
 SHIB RSI. Source:
TradingView
SHIB RSI. Source:
TradingView
The historical RSI of nearly 90 during SHIB’s peak at $0.000033 represented an extreme overbought condition that was unsustainable. The current drop to 51.8 suggests a healthy consolidation phase rather than a trend reversal, as readings between 40-60 typically indicate stable market conditions.
While this cooling off might lead to a short-term price correction, it doesn’t necessarily signal the end of the uptrend. It allows for more sustainable price growth by preventing market exhaustion.
Whales Are Not Accumulating Shiba Inu
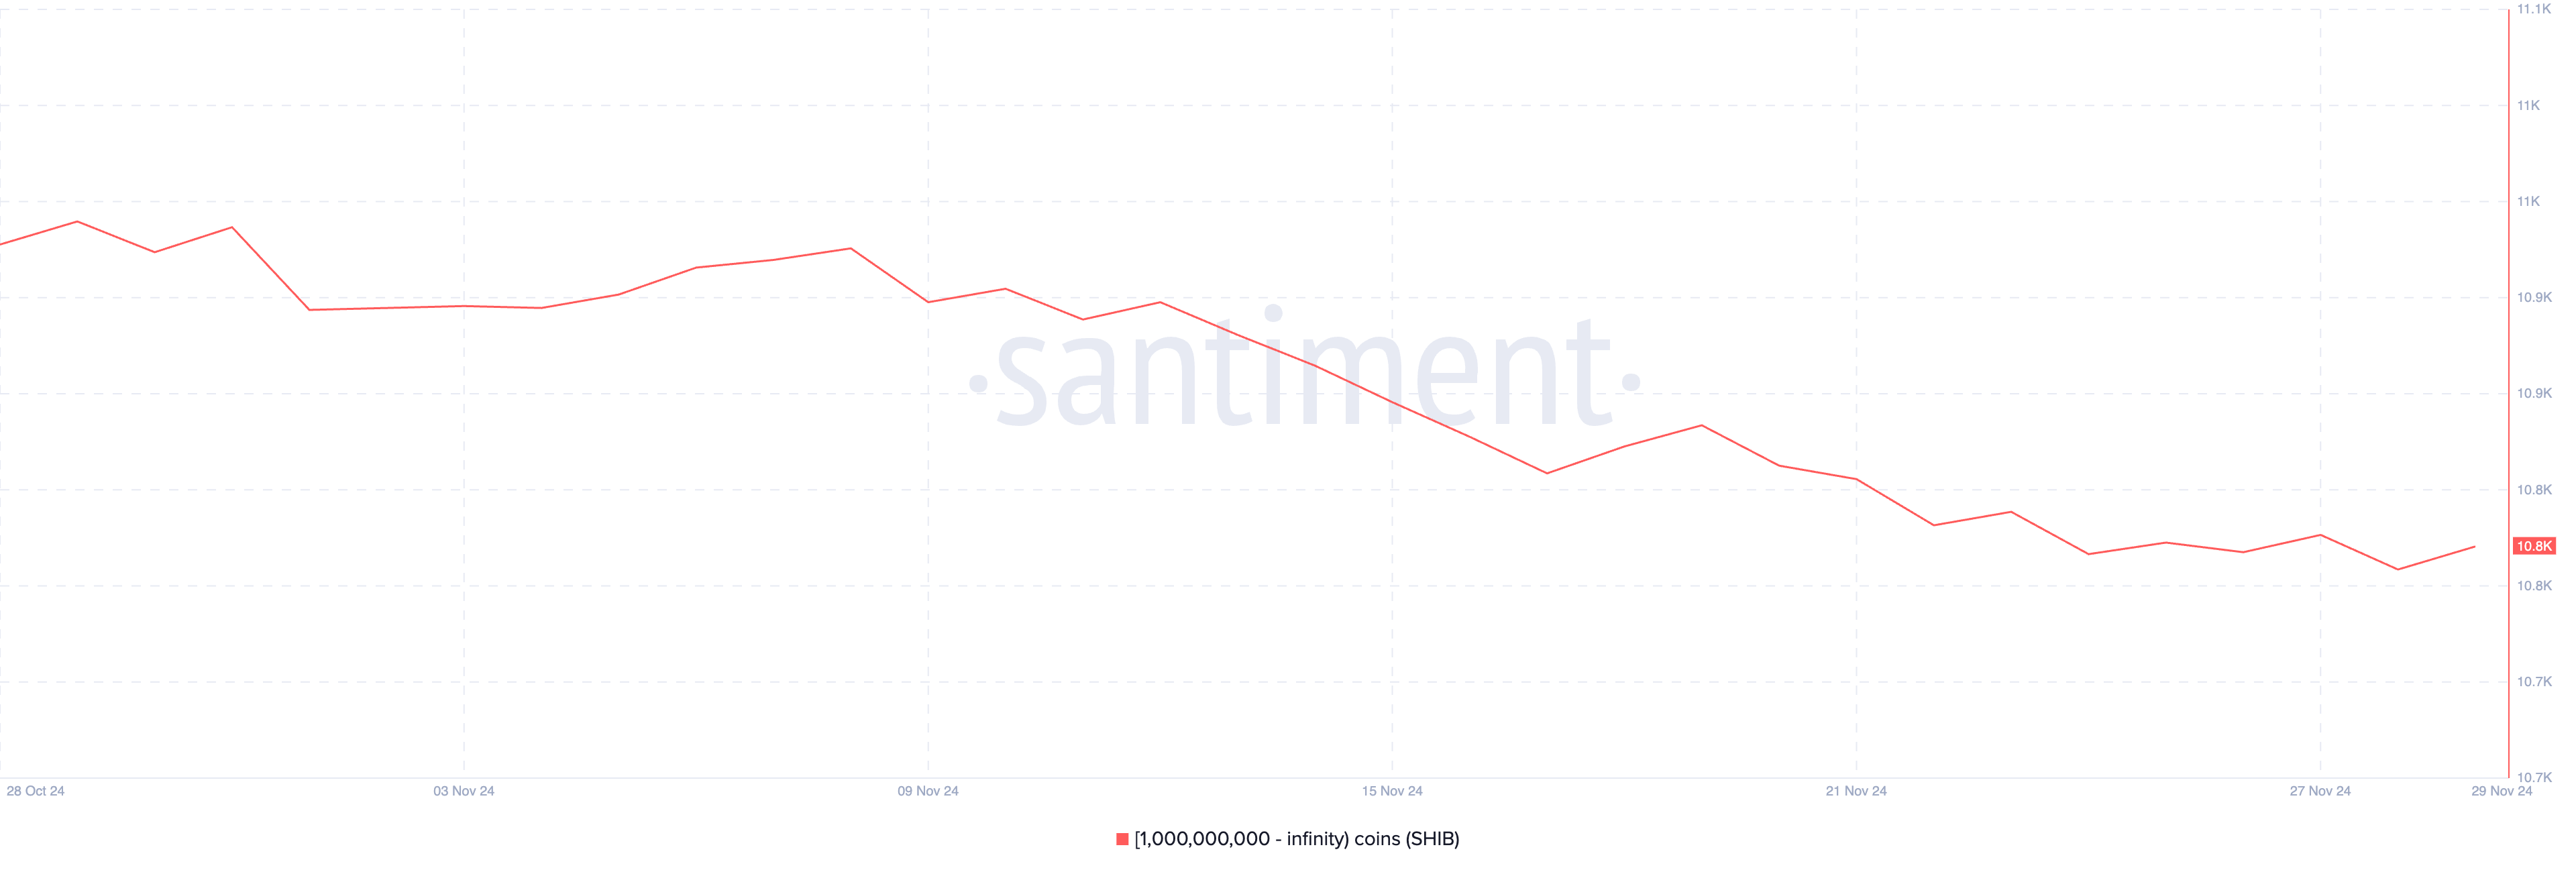
The declining number of SHIB whales indicates large holders are taking profits or reducing exposure during recent price increases.
Whales, who can significantly impact the market due to their large holdings, often set market trends that smaller investors follow. Their gradual exit suggests caution about SHIB’s current valuation levels.
 Holders with at least 1 billion SHIB. Source:
Santiment
Holders with at least 1 billion SHIB. Source:
Santiment
The drop from 11,013 to 10,858 wallets holding over 1 billion SHIB represents a loss of 155 major holders in just one month. This distribution of tokens from large to smaller holders typically creates selling pressure and could signal a weakening bullish sentiment.
However, this redistribution also means SHIB ownership is becoming more decentralized, which can be healthy for long-term price stability despite short-term selling pressure.
SHIB Price Prediction: Is a 17% Correction Imminent?
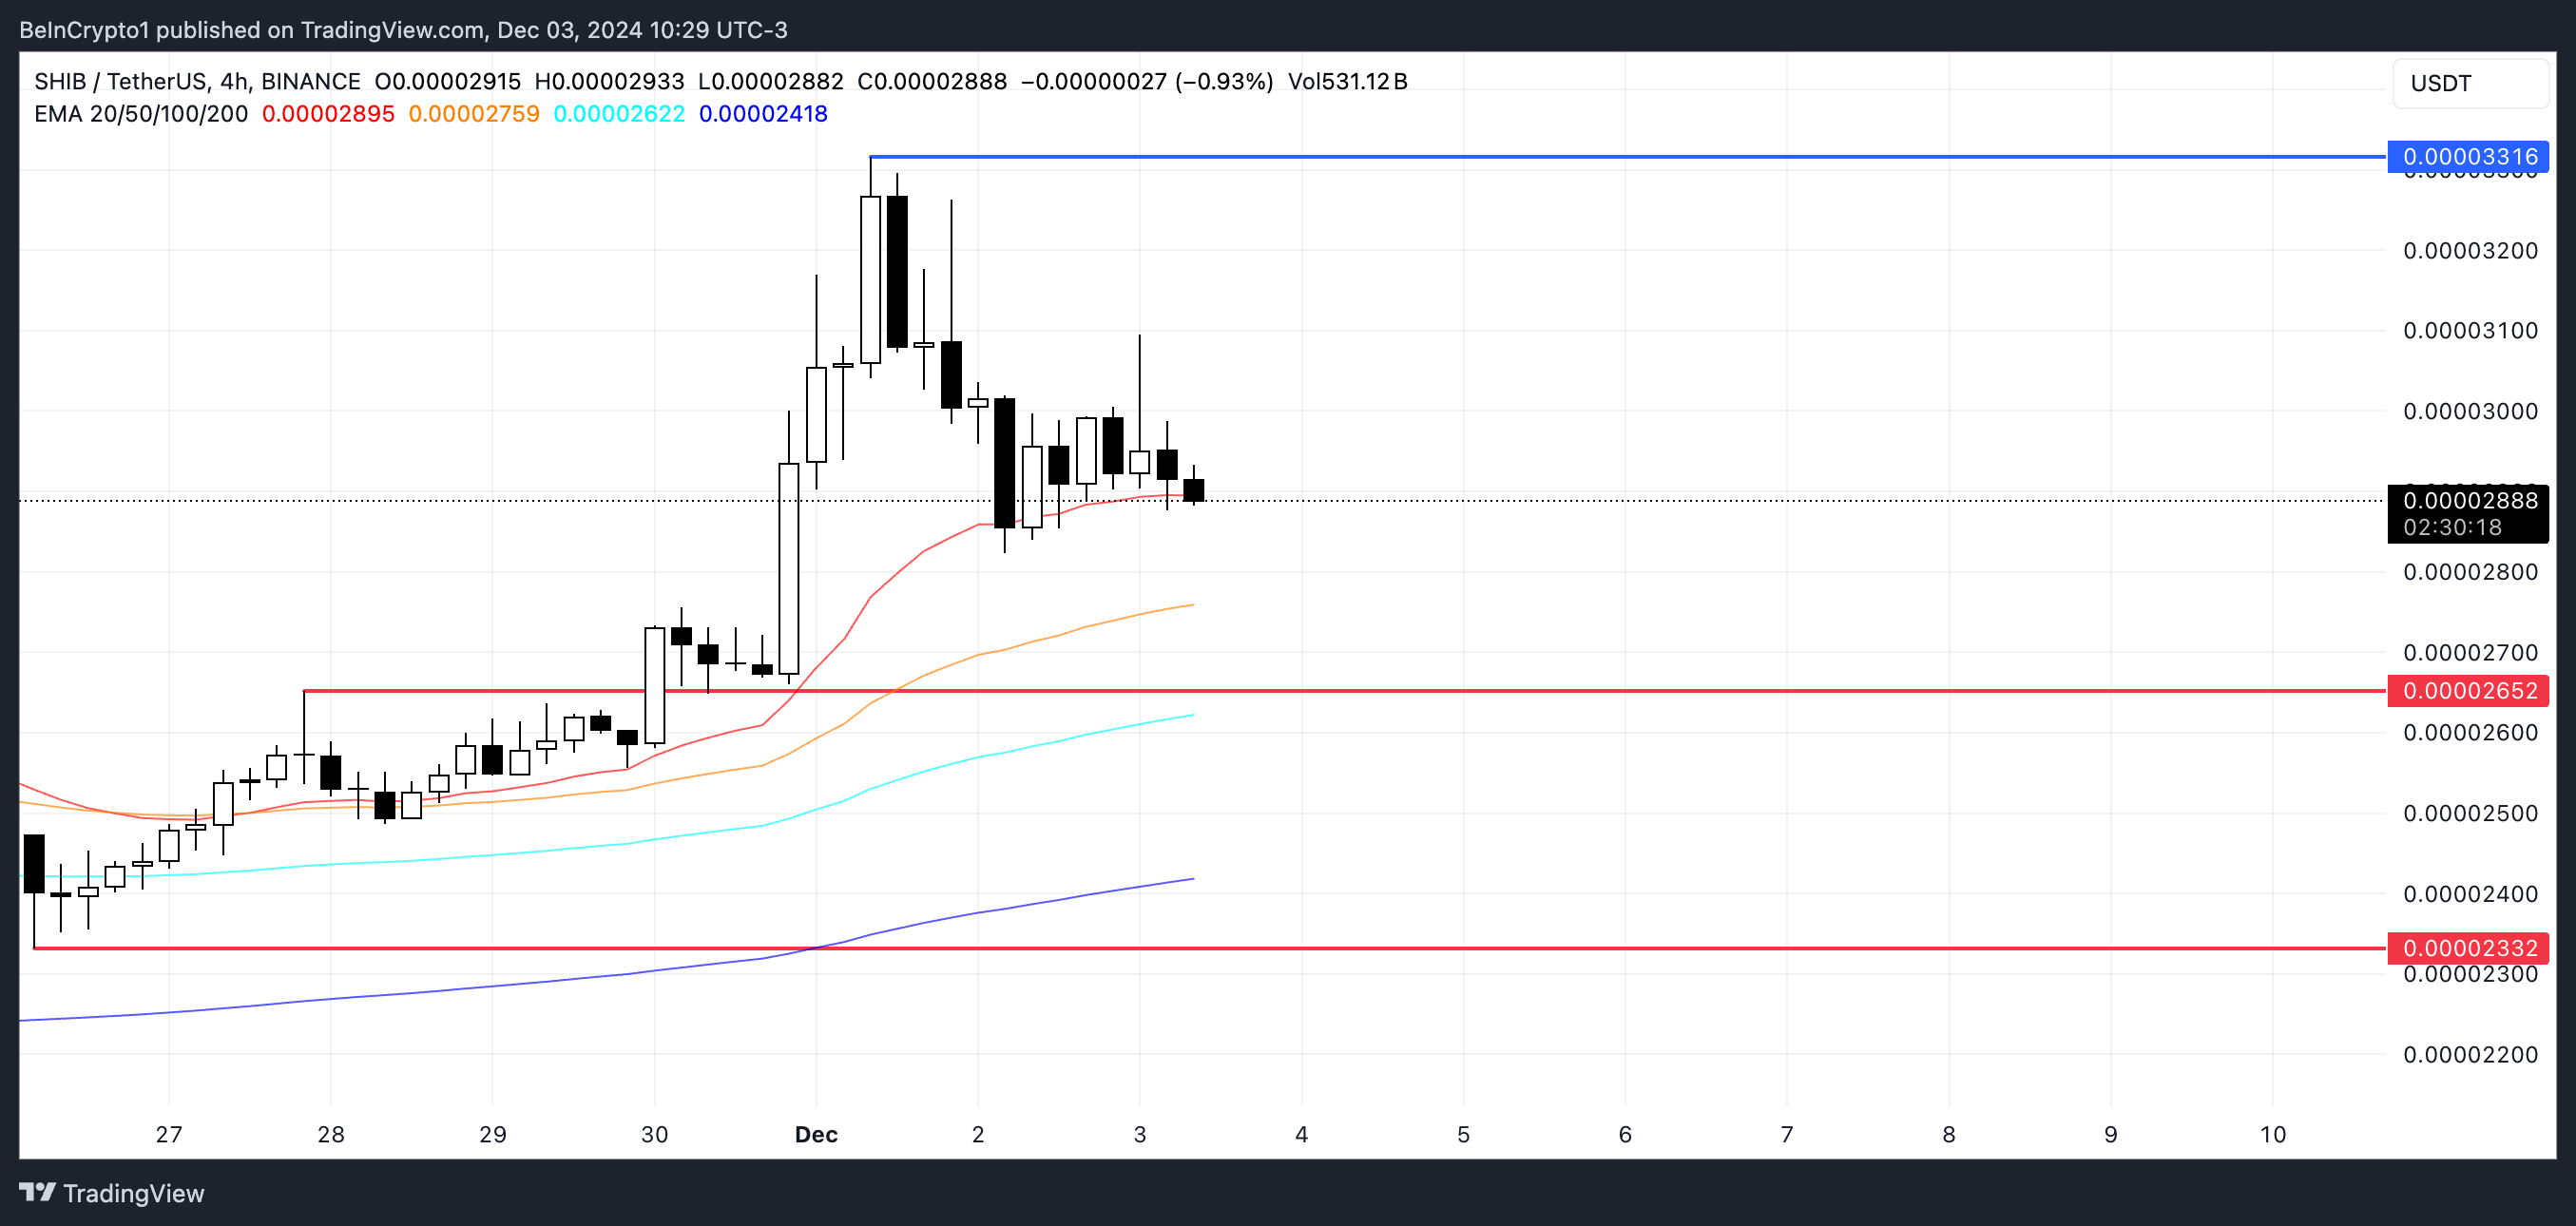
Shiba Inu price falling below the shortest EMA line signals momentum loss in its recent bullish trend.
While longer-term EMAs remain bullish, the price action beneath the fastest-moving average suggests that short-term bearish pressure is building.
 SHIB Price Analysis. Source:
TradingView
SHIB Price Analysis. Source:
TradingView
The price is now at a critical junction with significant price swings possible in either direction. A bearish scenario could drive SHIB price down to test $0.000026 and $0.000023 support levels, representing a 17.8% decline.
Conversely, if bulls regain control, SHIB price could retest its recent high of $0.000033 and potentially surge to $0.000040, offering a 42% upside from current levels.
Disclaimer: The content of this article solely reflects the author's opinion and does not represent the platform in any capacity. This article is not intended to serve as a reference for making investment decisions.
You may also like
Dow Jones Industrial Average bounces on Iran's latest Hormuz offer
U.S. stocks opened higher and fluctuated, the Japanese yen rebounded more than 1% intraday, 10-year U.S. Treasury yields broke above 5.22% again, and U.S. crude oil once fell nearly 3%.
After the release of U.S. consumer confidence data, the S&P and Nasdaq turned negative, while the Dow is poised to break a three-day losing streak but is set for a fourth consecutive weekly decline. Meta pulled back, falling more than 3% during the session. The U.S. 10-year Treasury yield surpassed 5.22% again, marking a new high for the third day in a row since 2007, while the 30-year yield reached its highest level since 2004. The yen/dollar pair surged 1.2% intraday, as Japanese and U.S. officials successively signaled concerns over the weak yen. Expectations for a diplomatic resolution between the U.S. and Iran are rising, halting crude oil's two-day climb.
US Treasury volatility surges, triggering alarms! BofA’s Hartnett warns of rising deleveraging risks as higher yields become main threat to the market
Bank of America strategist Michael Hartnett warns that the recent sharp rise in volatility in the US bond market is increasing the risk of broader deleveraging in financial markets.
U.S. diesel prices surge 83% this year! Apollo Chief Economist warns: Cost pass-through may make core inflation more stubborn, Federal Reserve can't ignore it
Torsten Slok, Chief Economist at Apollo Global Management, has warned that the inflation threat posed by the surge in U.S. diesel prices to historic highs may be more serious than the Federal Reserve currently realizes.
Crypto prices
More


