
Uniswap (UNI) Jumps 20%, Marks Highest Price in 3 Years

UNI price climbs 20% in 24 hours, testing key resistance. RSI and BBTrend hint at bullish potential, with $25 back in focus for UNI.
Uniswap (UNI) price has surged nearly 20% in the last 24 hours, reaching its highest levels in three years. This rapid rally has pushed UNI price closer to breaking key resistance levels that could lead to even greater gains.
Metrics such as RSI and BBTrend suggest improving momentum, with the potential for continued upward movement if bullish sentiment holds. However, maintaining strong support at $14.5 will be crucial to sustaining this uptrend and avoiding a deeper pullback.
UNI RSI Is Still Below the Overbought Zone
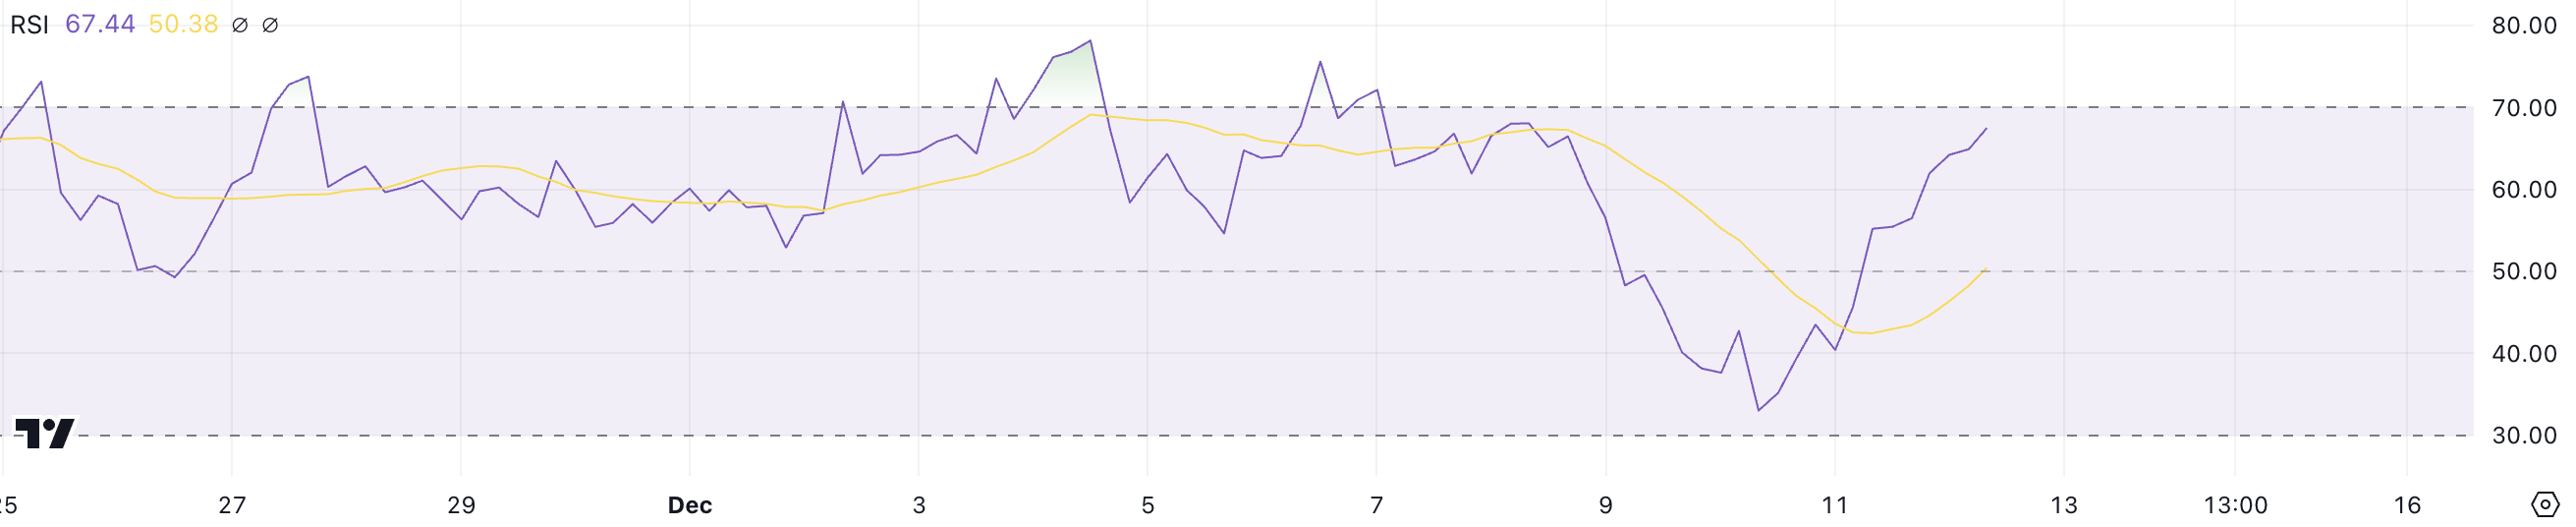
Uniswap RSI has surged from 33 two days ago to 67, reflecting a sharp increase in bullish momentum. This rapid rise indicates that the asset has moved from oversold conditions into a more neutral-to-bullish range, aligning with its recent price recovery.
The current RSI level suggests strong buying activity, but it is nearing the overbought threshold, where further upward movement could face resistance if buying momentum slows.
 UNI RSI. Source:
TradingView
UNI RSI. Source:
TradingView
RSI, or Relative Strength Index, measures the speed and magnitude of price changes to assess overbought or oversold conditions. Values below 30 indicate oversold levels, signaling potential buying opportunities, while values above 70 suggest overbought conditions that can lead to price corrections.
If UNI’s RSI can break past 70 and sustain itself above this level without an immediate correction, Uniswap price could continue rising. Historical trends show that when UNI’s RSI remained above 70 for extended periods, it often preceded significant price gains before a pullback occurred, suggesting further upside potential in the short term.
Uniswap BBTrend Is Now Negative
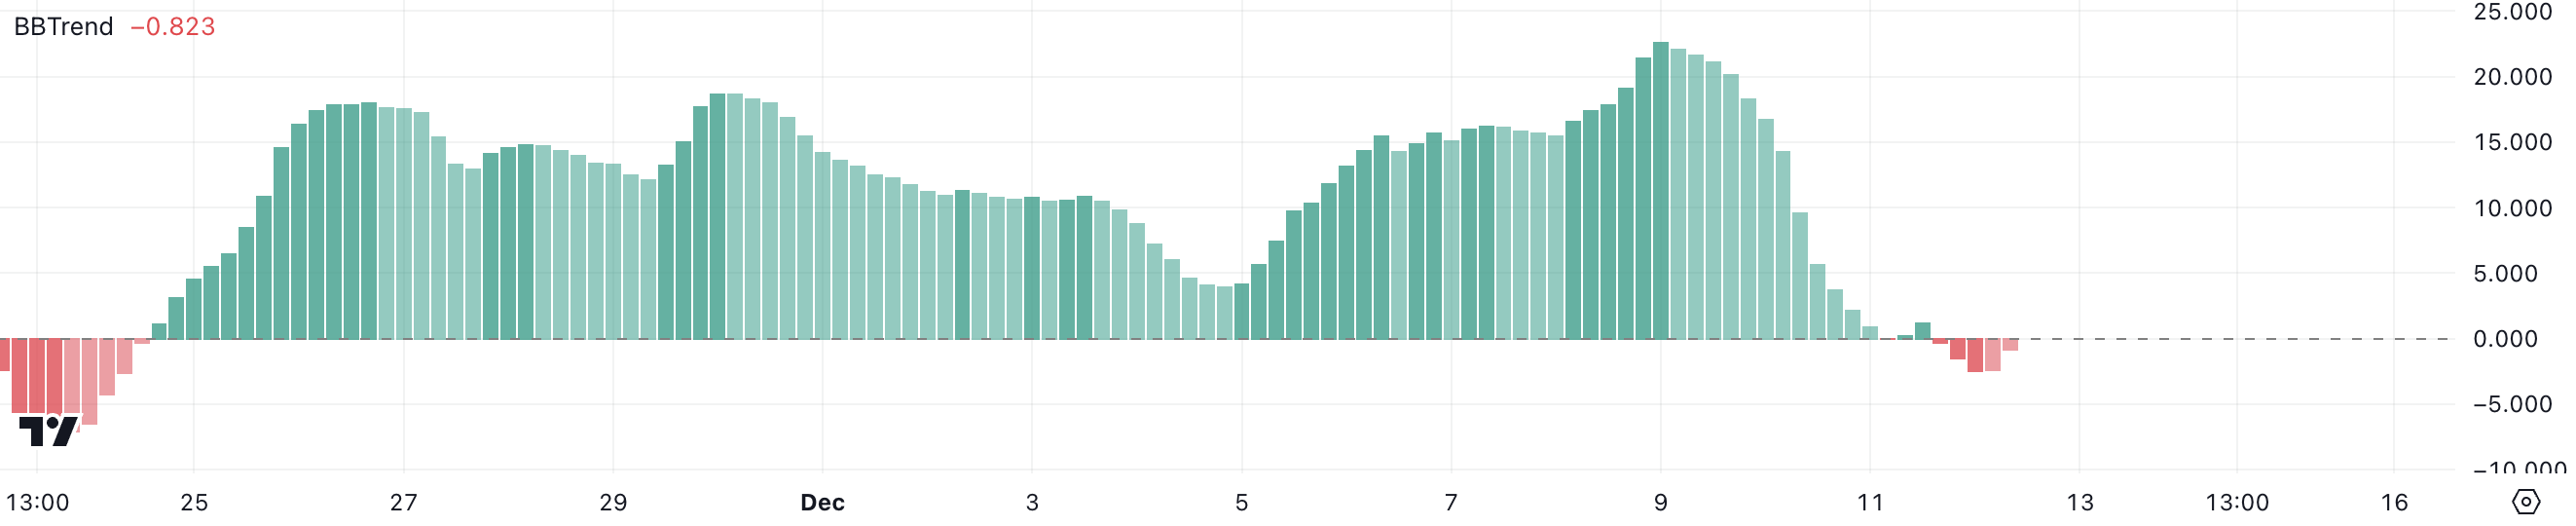
UNI BBTrend has recovered to -0.82, up from -2.47 a few hours ago, signaling an improvement in price momentum. This shift indicates that the bearish pressure seen earlier is easing, suggesting a potential stabilization or even a reversal toward bullish conditions.
Although the BBTrend remains in the negative zone, the upward movement reflects growing support and a possible return of buying interest.
 UNI BBTrend. Source:
TradingView.
UNI BBTrend. Source:
TradingView.
BBTrend, or Bollinger Band Trend, measures the strength and direction of price movements based on Bollinger Bands. Positive values indicate bullish momentum, while negative values signal bearish conditions. Uniswap BBTrend was positive from November 24, peaking at 22.6 on December 9, before turning negative between December 11 and 12.
The recent recovery from -2.47 to -0.82 suggests that selling momentum is weakening. If BBTrend turns positive again, UNI price could see an even bigger surge.
UNI Price Prediction: Can It Get Back to $25 After 3 Years?
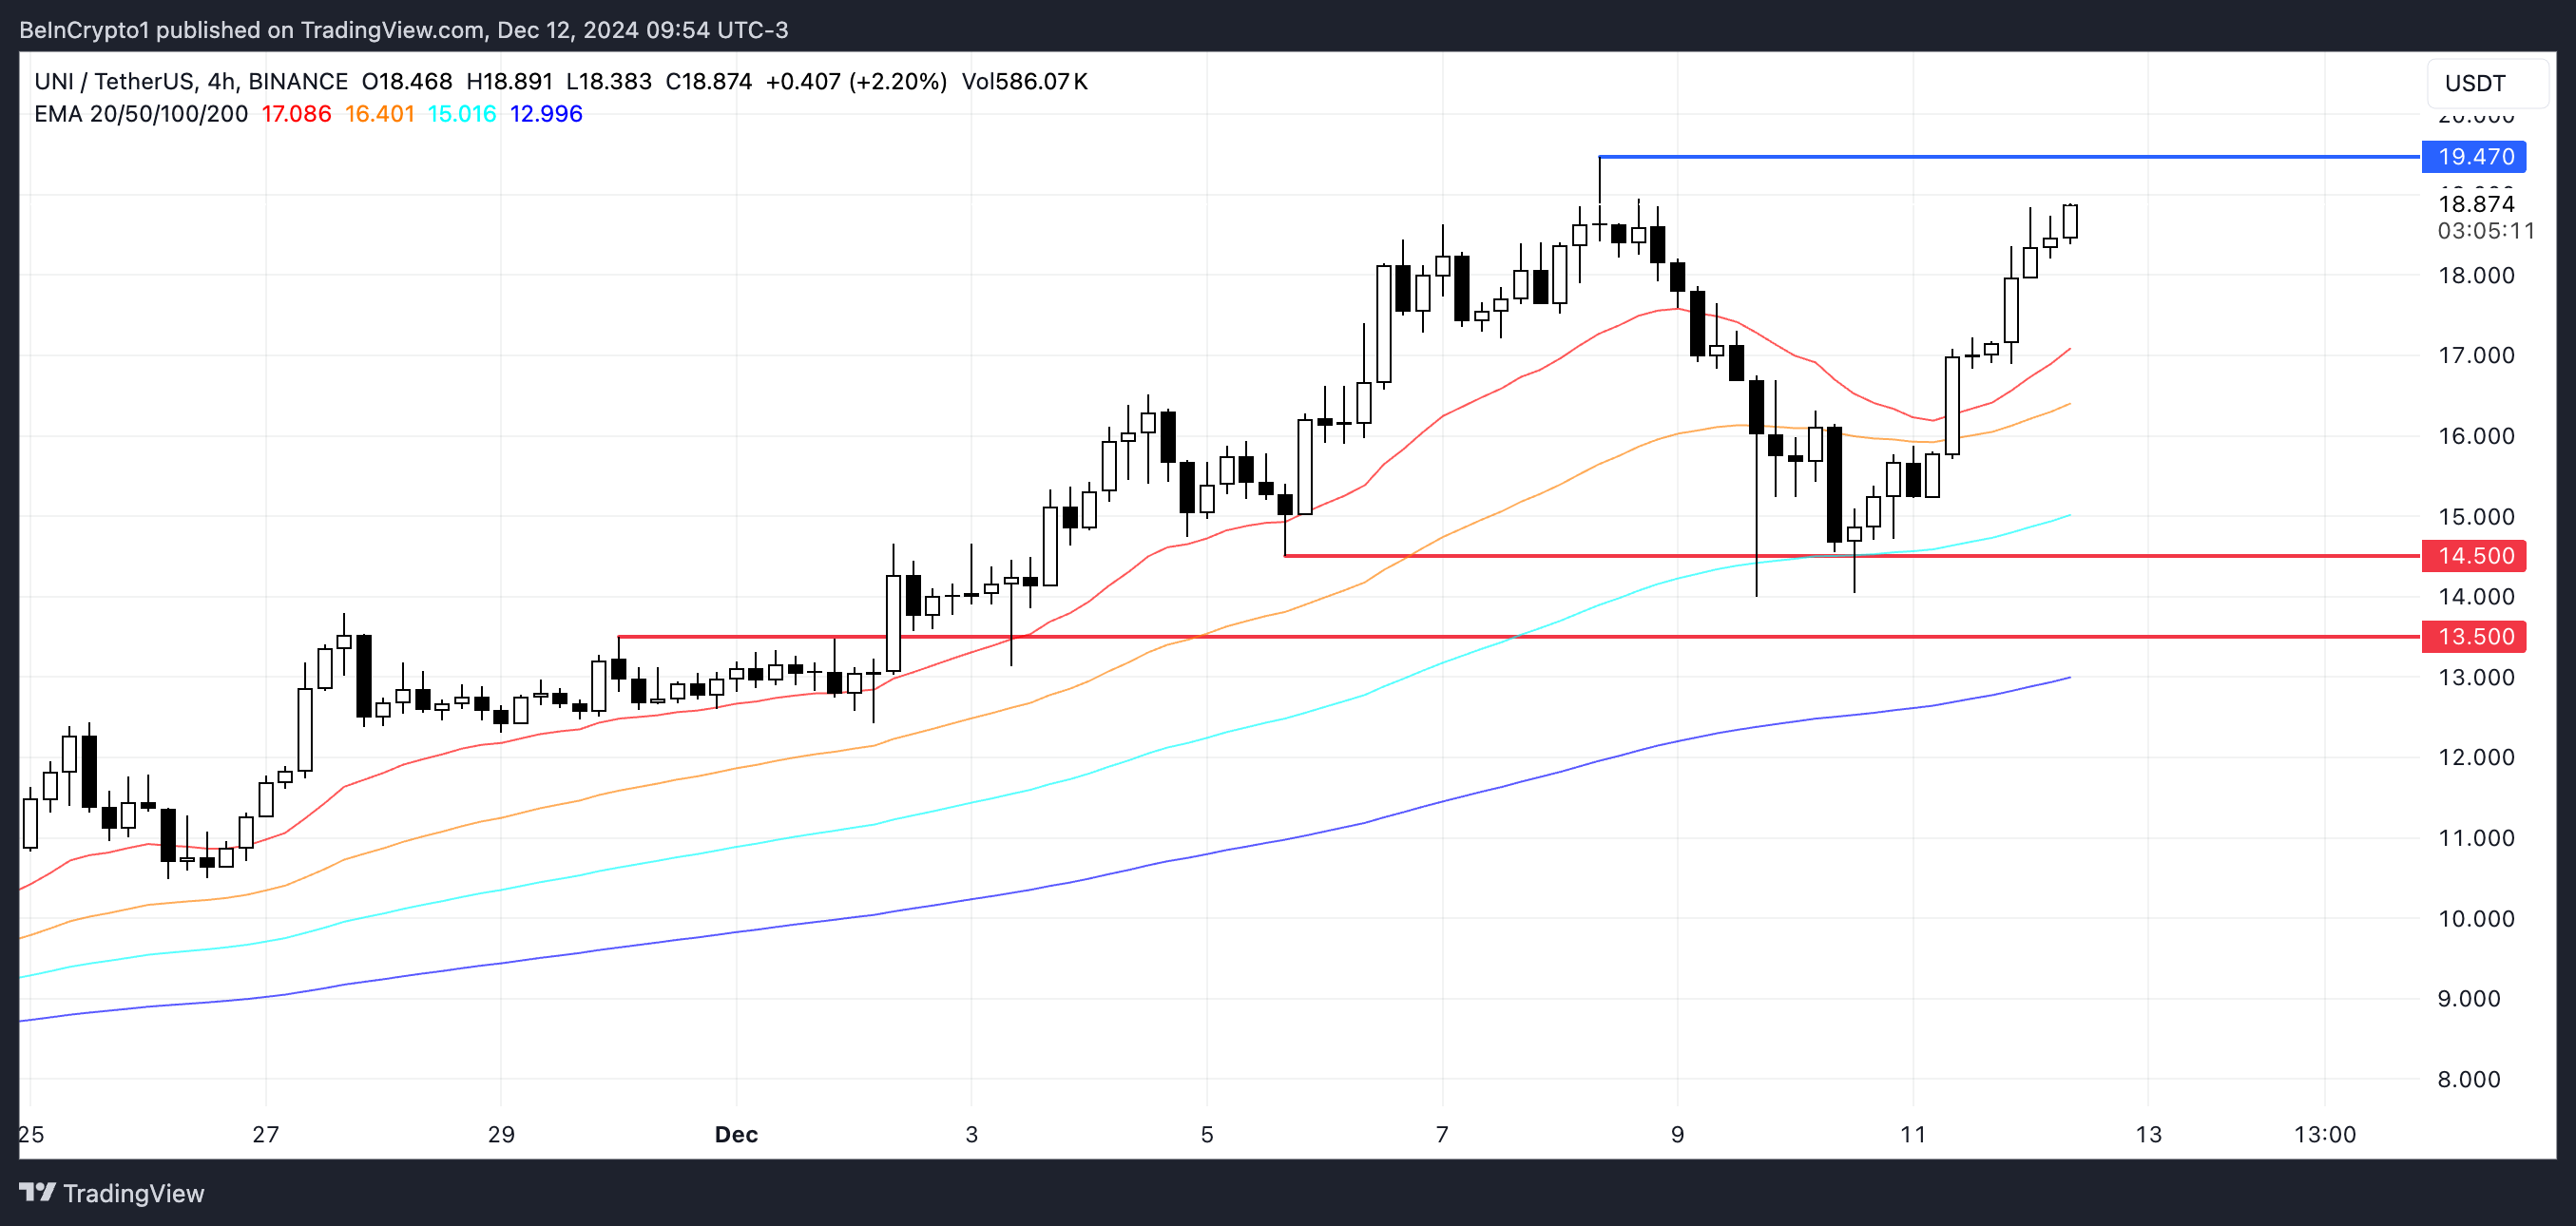
UNI price currently holds a strong support level around $14.5, which could serve as a key area to stabilize the price in case of a downtrend. If this support fails, the price could drop further, potentially testing $13.5 as the next significant level.
These support zones are crucial to prevent a deeper correction and maintain market confidence during periods of selling pressure.
 UNI Price Analysis. Source:
TradingView
UNI Price Analysis. Source:
TradingView
On the other hand, if the current uptrend persists, UNI price could soon test resistance at $19.47, with the potential to rise to $20. Breaking these levels would mark Uniswap’s highest price in three years, signaling strong bullish momentum.
A continued rally toward $25 would represent its highest price since November 11, 2021, highlighting a possible return to the long-term bullish territory if the uptrend strengthens further.
Disclaimer: The content of this article solely reflects the author's opinion and does not represent the platform in any capacity. This article is not intended to serve as a reference for making investment decisions.
You may also like
AI agents drive shift from XRP to stablecoins on XRP Ledger, BlackRock says
Why suspend RMPs? Explanation from New York Fed SOMA Manager Perli
"Agent vs US Treasury" — Who Will Dominate the US Stock Market?
The wave of AI Agents and US Treasury yields are splitting the US stock market into two worlds: Meta's release of the Muse model boosted its market value by $220 billion in a single week, propelling the Nasdaq's standout performance; however, excluding AI stocks, the S&P 500 actually fell 1% this week, with the number of new lows on the New York Stock Exchange surpassing new highs for nine consecutive days, signaling the near end of "breadth trading." Goldman Sachs bluntly stated that this is a "frustrating cat-and-mouse game" between the stock market and interest rates—any breakout can be snuffed out by the bond market at any time, so equity holders must short US Treasury bonds to hedge simultaneously.
Hopes for a ceasefire between the US and Iran encounter obstacles again! Trump rejects Iran's seven-day proposal; inflation pressure under $100 oil prices remains difficult to ease
Trump rejects a ceasefire with Iran, and it is expected that bombings will occur again after the midterm elections. The president doubts whether Tehran will meet his demands.
Crypto prices
More


