
Solana Price Prediction: Will SOL Price Break Through $300 in January 2025?

Recent Performance and Current Solana Price
As of January 23, 2025, Solana (SOL) is trading at $244.36 , slightly down from its recent intraday high of $270.39. The token has shown resilience, maintaining a strong position despite market fluctuations. SOL's price trajectory suggests it may be poised for a breakout, provided it can reclaim and sustain key resistance levels.
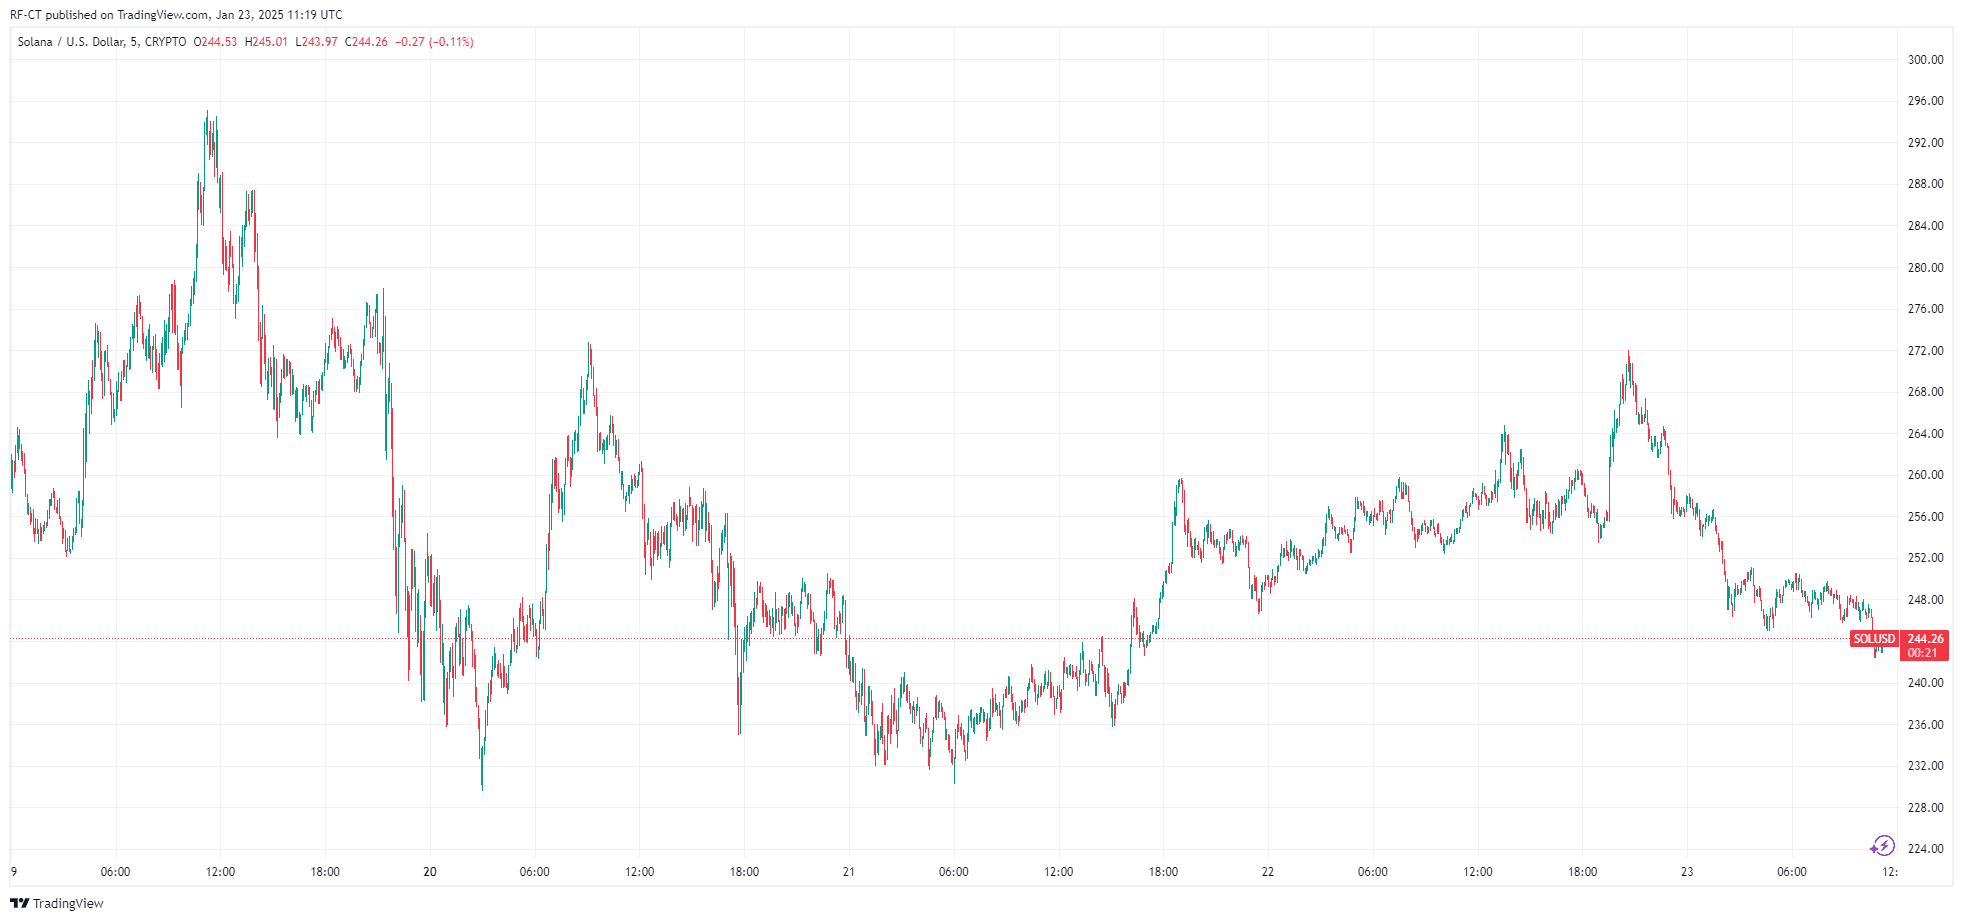 By TradingView - SOLUSD_2025-01-23 (5D)
Key Market Influences on Solana Price
1. Regulatory Developments
The recent formation of a cryptocurrency task force under the leadership of SEC Commissioner Hester Peirce has fueled optimism across the crypto market. This initiative, launched under the new U.S. administration, aims to establish a clear regulatory framework, which could encourage institutional participation and positively impact major tokens like SOL .
2. Launch of TRUMP Token on Solana
The recent launch of the TRUMP meme coin on the Solana blockchain has also contributed to increased attention on the platform. Announced on Truth Social, the token reached an $8 billion market cap within hours of its release, showcasing the blockchain's scalability and low transaction fees. Such events continue to strengthen Solana's position as a preferred blockchain for high-profile projects .
Solana Price Prediction: Path to $300 and Beyond SOON?
Analysts highlight the $260 price level as a critical resistance point for SOL. Reclaiming and sustaining this level could signal a bullish trend, potentially pushing the token toward $300 and higher in the coming weeks.
Additionally, longer-term projections suggest SOL price might hit $400 by the end of 2025 , driven by ecosystem growth and the potential approval of Solana-based ETFs . However, delays or rejections by regulatory authorities could temper expectations.
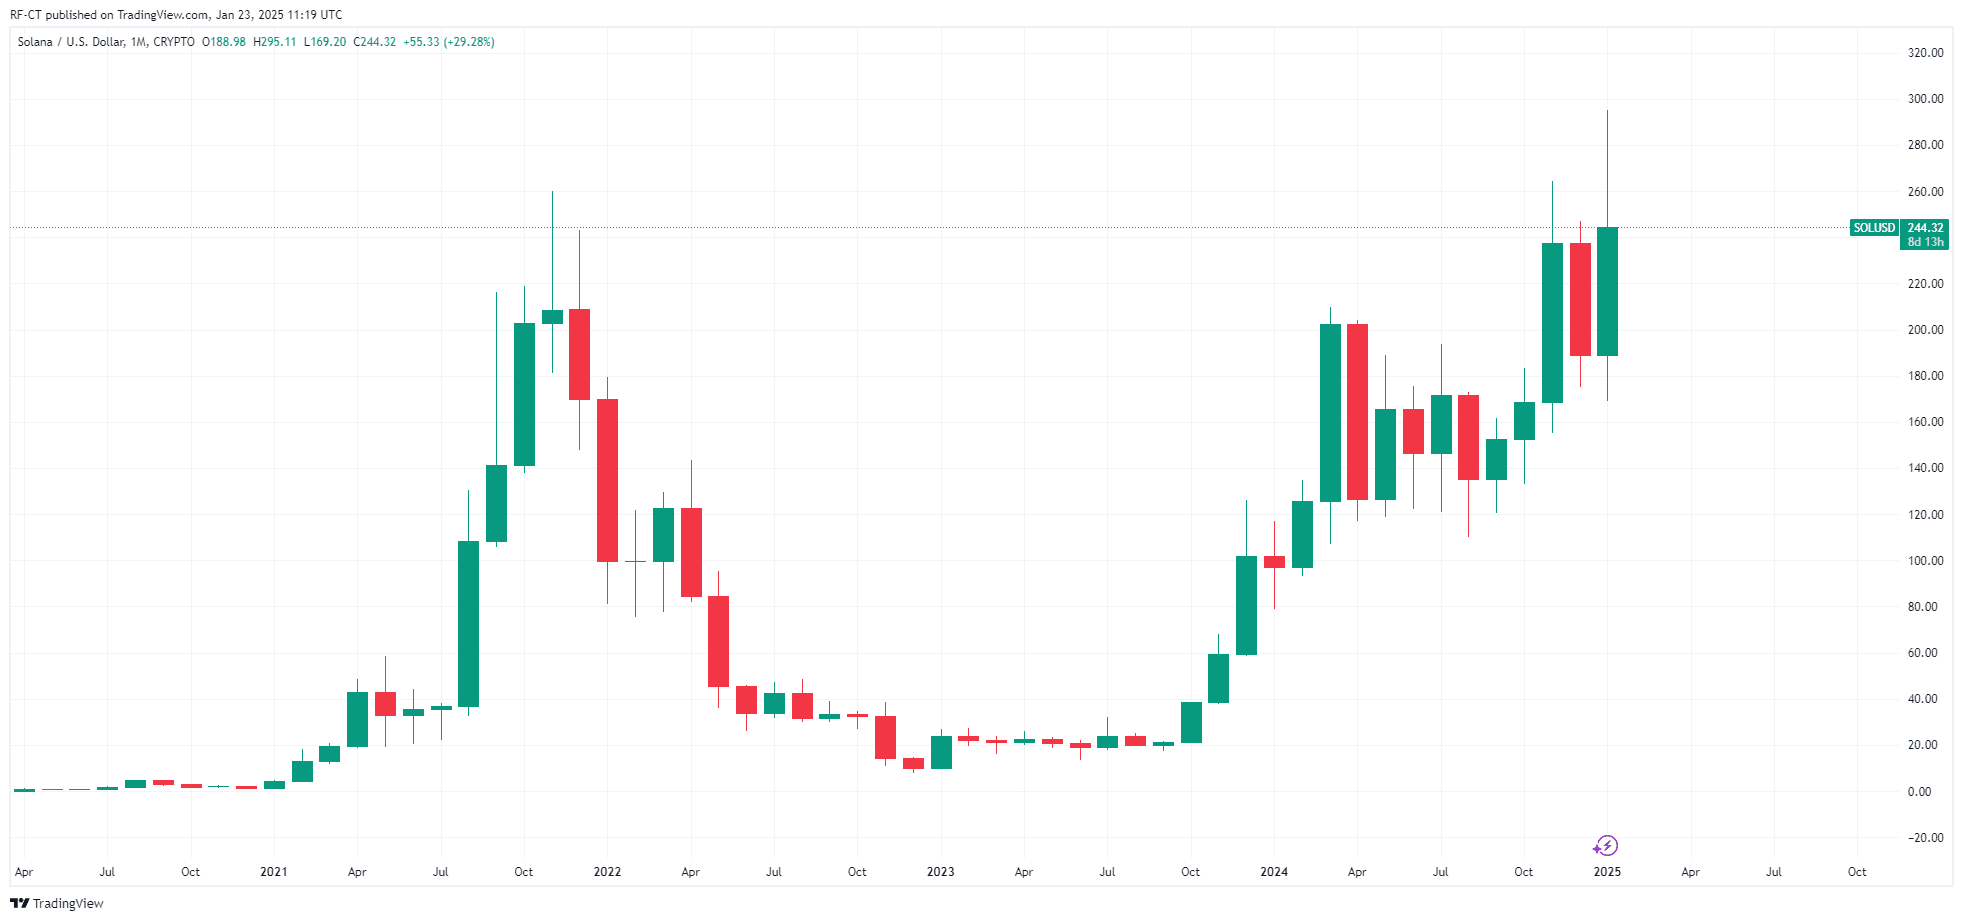 By TradingView - SOLUSD_2025-01-23 (All)
Solana Price Analysis: What’s Next for SOL Price?
Solana technical indicators point to a pivotal moment:
- Support Level: $240
- Resistance Level: $260
Breaking through $260 could position SOL for new highs. Analysts emphasize that surpassing this level will likely trigger additional buying interest, setting the stage for a rally toward $300.
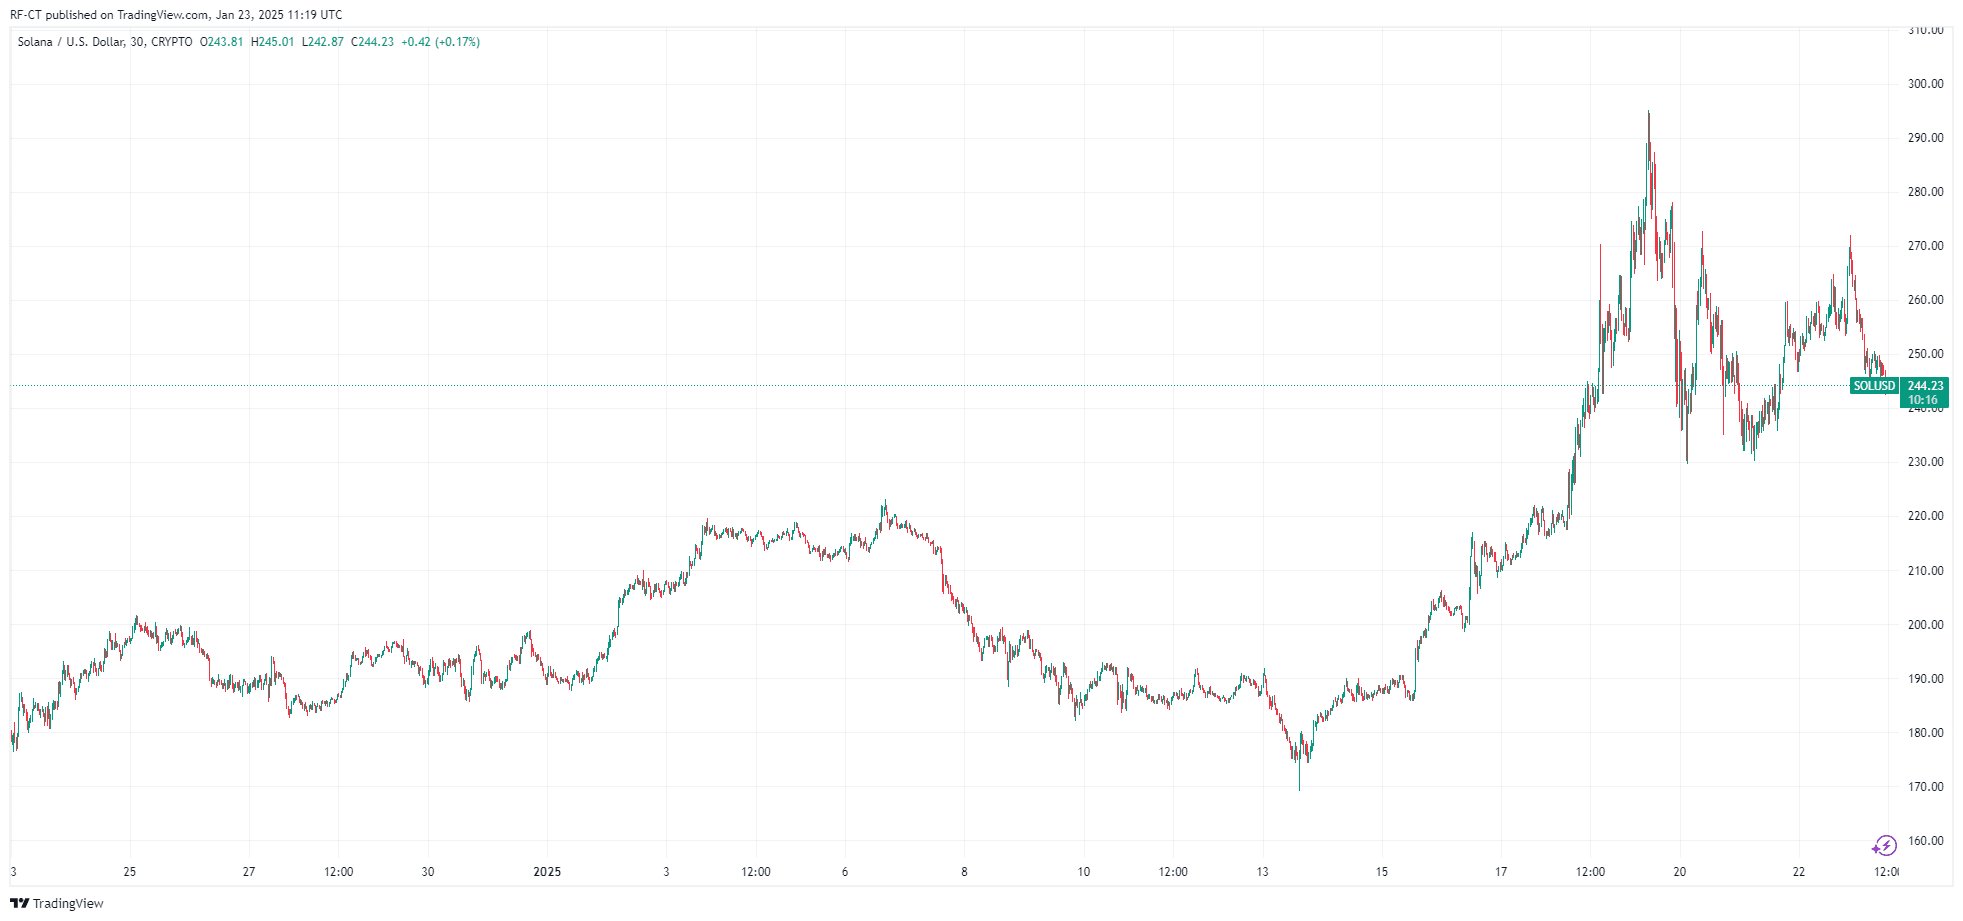 By TradingView - SOLUSD_2025-01-23 (1M)
Conclusion: Will SOL Price Break Through $300 in January 2025?
Solana remains one of the most promising cryptocurrencie s, backed by strong fundamentals, technological innovation, and a growing ecosystem. While the current price reflects some consolidation, its potential for growth remains robust.
As the crypto market evolves with regulatory clarity and high-profile projects like $TRUMP, Solana is well-positioned to capitalize on these developments. Keep an eye on the $260 resistance level—breaking past it could mark the start of Solana's next big move.
Disclaimer: The content of this article solely reflects the author's opinion and does not represent the platform in any capacity. This article is not intended to serve as a reference for making investment decisions.
You may also like
US Treasury yield curve approaches inversion! Is the bond market questioning the outlook for the US economy?
The U.S. Treasury yield curve is rapidly approaching the inversion threshold—the spread between the 10-year and 2-year yields has narrowed to historic lows, and bank stocks have responded with a technical correction. This warning signal, regarded as a "hard rule" for recession, is tearing apart market consensus: some are betting the curve will soon invert, while others firmly believe economic resilience will mitigate the risk. Amid ongoing Federal Reserve rate hikes, the outcome of this bond market game may reshape the narrative logic of the entire asset market.

From ICU to KTV! The Polarized "AI Narrative" Leaves Investors "Exhausted"
In just two weeks, the Nasdaq 100 experienced an extreme rollercoaster: first losing $600 billion in market value due to “AI threat” concerns, then rebounding to reclaim $3 trillion thanks to the viral Meta assistant. Analysts believe that market sentiment is swinging violently between fear and greed, detached from fundamentals. The turmoil has driven Nvidia’s valuation to a ten-year low, intensified the bull-bear divide, and the high volatility driven by narratives has become a long-term norm for investors. This week, Micron will release its financial report; regardless of the outcome, the sharp swings in market sentiment are unlikely to subside.
Weekly Preview: Micron (MU.US) earnings test the quality of AI infrastructure, OpenAI and White House AI meeting resonance, PCE and Nonfarm Payrolls set the tone for October interest rates
This week, the market's focus will shift from politics and product launches to financial reports and macroeconomic data.
"Over 5% 10-Year US Treasury Yield" Fails to Crush AI Investment Frenzy—Is the Real "AI Kill Line" an Inverted Yield Curve?
The bond market is gradually sending warning signals to the economy, indicating that the Federal Reserve's series of interest rate hikes will begin to shift market sentiment, making people increasingly concerned that the US economy may fall into stagnation.

Crypto prices
More


