
Bitcoin Price Analysis: Can Bitcoin Break Its Current Resistance and Surge Higher?

Bitcoin's price has been moving steadily upward in recent weeks, showing signs of renewed investor confidence and potential for further gains. However, several critical levels on the daily chart indicate that the current rally faces significant hurdles. Let's dive into the technical analysis and explore the possibilities for Bitcoin's price trajectory in the coming days.
What Does the Current Bitcoin Price Action Tell Us?
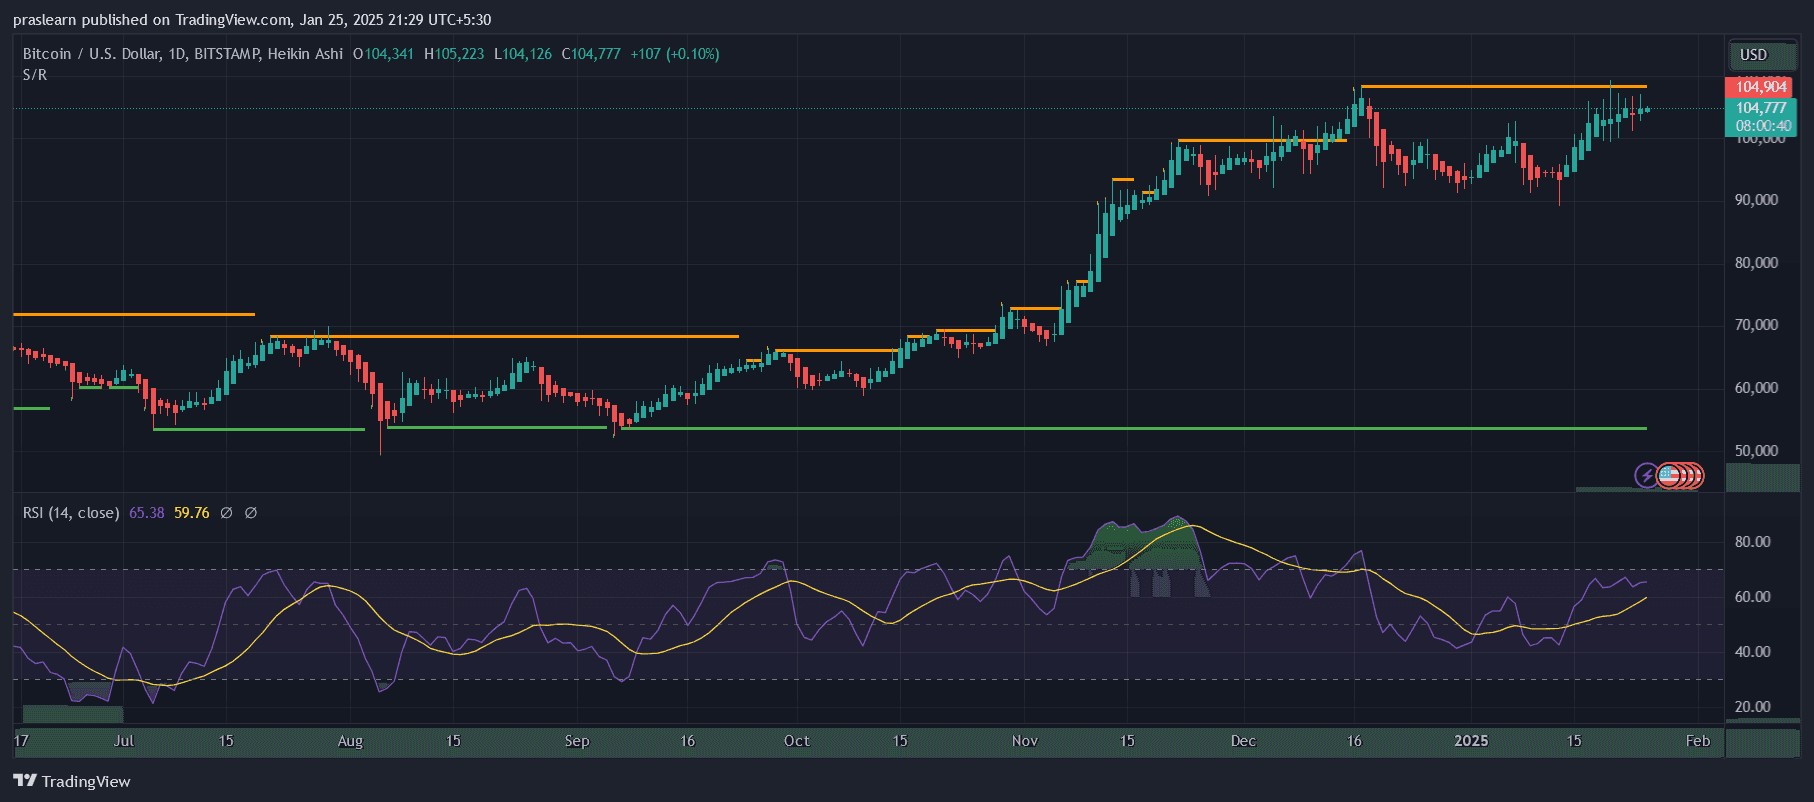 BTC/USD Daily Chart- TradingView
The daily chart shows Bitcoin trading just below a key resistance level around $105,000, which aligns with previous highs marked by horizontal orange lines. These levels have acted as formidable barriers in the past, with multiple rejections visible over the last few months. Each time Bitcoin has approached this level, it has either consolidated or corrected lower. The current attempt appears stronger, given the series of higher lows that signify growing bullish momentum.
The candlestick patterns, especially the Heikin Ashi bars, indicate a steady uptrend with minimal downside wicks, showing reduced selling pressure. The price has also remained consistently above support levels near $95,000, as shown by the horizontal green line. This suggests that buyers are stepping in to defend the trend, giving Bitcoin a robust foundation for potential upward moves.
Is the RSI Signaling Overbought Conditions?
The Relative Strength Index (RSI) currently hovers around 65, which is below the overbought threshold of 70. This indicates that while Bitcoin is approaching overbought conditions, there is still room for the rally to continue without triggering significant profit-taking. However, it is essential to note the divergence between the RSI and price movement during previous rallies. On some occasions, the RSI failed to reach higher peaks, leading to short-term corrections.
Additionally, the RSI trendline has been rising steadily, showing no immediate signs of reversal. As long as Bitcoin maintains RSI levels below 70 without sharp declines, the bullish momentum could remain intact. If the RSI breaks above 70 in tandem with a price breakout, it could confirm the strength of the next leg upward.
Bitcoin Price Analysis: Are We on the Verge of a Breakout or Reversal?
The current consolidation beneath resistance raises the question of whether Bitcoin will break out or reverse . For a breakout to occur, Bitcoin needs to close decisively above $105,000 on strong volume. Such a move could pave the way for a rapid rise toward $115,000, the next significant psychological and technical level.
However, if Bitcoin fails to breach this resistance and begins to form lower highs, it could signal a reversal. In that scenario, the price may retest the $95,000 support level. A breakdown below this support could expose Bitcoin to further downside, potentially targeting $85,000, a level of historical significance.
What Are the Broader Implications for Bitcoin Price?
Bitcoin's recent strength can be attributed to macroeconomic factors, including an improving risk-on sentiment in the financial markets and renewed institutional interest. Additionally, upcoming Bitcoin halving events and decreasing mining supply are boosting long-term investor optimism.
While these fundamentals support a bullish outlook, traders should remain cautious of potential market volatility. The current resistance level has been tested multiple times, and a false breakout could lead to heightened selling pressure. Monitoring volume, RSI behavior, and candlestick patterns will be crucial in determining the next significant move.
Will Bitcoin Price Soar or Stumble?
Bitcoin's price action suggests that the cryptocurrency is at a critical juncture. The battle between bulls and bears near the $105,000 resistance level will likely define the trend for the weeks ahead. If Bitcoin can break out decisively, it could set the stage for a rally toward $115,000 or higher. However, a rejection at this level may lead to a retest of support, with the risk of further downside if the $95,000 level fails to hold.
Investors and traders should watch for confirmation signals before committing to their positions. The market's direction will depend on a delicate balance between technical momentum and broader market sentiment. For now, Bitcoin's trajectory remains promising, but caution is advised as it approaches a critical inflection point.
Disclaimer: The content of this article solely reflects the author's opinion and does not represent the platform in any capacity. This article is not intended to serve as a reference for making investment decisions.
You may also like
US Treasury yield curve approaches inversion! Is the bond market questioning the outlook for the US economy?
The U.S. Treasury yield curve is rapidly approaching the inversion threshold—the spread between the 10-year and 2-year yields has narrowed to historic lows, and bank stocks have responded with a technical correction. This warning signal, regarded as a "hard rule" for recession, is tearing apart market consensus: some are betting the curve will soon invert, while others firmly believe economic resilience will mitigate the risk. Amid ongoing Federal Reserve rate hikes, the outcome of this bond market game may reshape the narrative logic of the entire asset market.

From ICU to KTV! The Polarized "AI Narrative" Leaves Investors "Exhausted"
In just two weeks, the Nasdaq 100 experienced an extreme rollercoaster: first losing $600 billion in market value due to “AI threat” concerns, then rebounding to reclaim $3 trillion thanks to the viral Meta assistant. Analysts believe that market sentiment is swinging violently between fear and greed, detached from fundamentals. The turmoil has driven Nvidia’s valuation to a ten-year low, intensified the bull-bear divide, and the high volatility driven by narratives has become a long-term norm for investors. This week, Micron will release its financial report; regardless of the outcome, the sharp swings in market sentiment are unlikely to subside.
Weekly Preview: Micron (MU.US) earnings test the quality of AI infrastructure, OpenAI and White House AI meeting resonance, PCE and Nonfarm Payrolls set the tone for October interest rates
This week, the market's focus will shift from politics and product launches to financial reports and macroeconomic data.
"Over 5% 10-Year US Treasury Yield" Fails to Crush AI Investment Frenzy—Is the Real "AI Kill Line" an Inverted Yield Curve?
The bond market is gradually sending warning signals to the economy, indicating that the Federal Reserve's series of interest rate hikes will begin to shift market sentiment, making people increasingly concerned that the US economy may fall into stagnation.

Crypto prices
More


