Bitget App
Trade smarter
Buy cryptoMarketsTradeFuturesEarnAISquareMore
Temtum Price Compresses at Critical Support as RSI Rebounds, Chart Eyes $144 Breakout

Temtum Price Compresses at Critical Support as RSI Rebounds, Chart Eyes $144 Breakout

CryptonewslandCryptonewsland2025/08/09 01:35
By:by Francis E
  • Temtum’s price touches key uptrend support, forming a triangle structure that has historically triggered strong upward movements.
  • The weekly RSI prints a higher low at oversold levels, reinforcing bullish momentum ahead of the August 8 earnings announcement.
  • Breakout targets are set at $124.01 and $144.86, derived from Fibonacci extensions within a low-supply, high-volatility price environment.

Temtum ($TEM) is now trading at a critical technical level, supported by a confluence of chart structure and momentum indicators. Price action has compressed into a narrowing triangle with the most recent candle touching the lower support line. Notably, this uptrend line has been respected several times since early 2023. 
Temtum Price Compresses at Critical Support as RSI Rebounds, Chart Eyes $144 Breakout image 0 Temtum Price Compresses at Critical Support as RSI Rebounds, Chart Eyes $144 Breakout image 1 Source: (X )

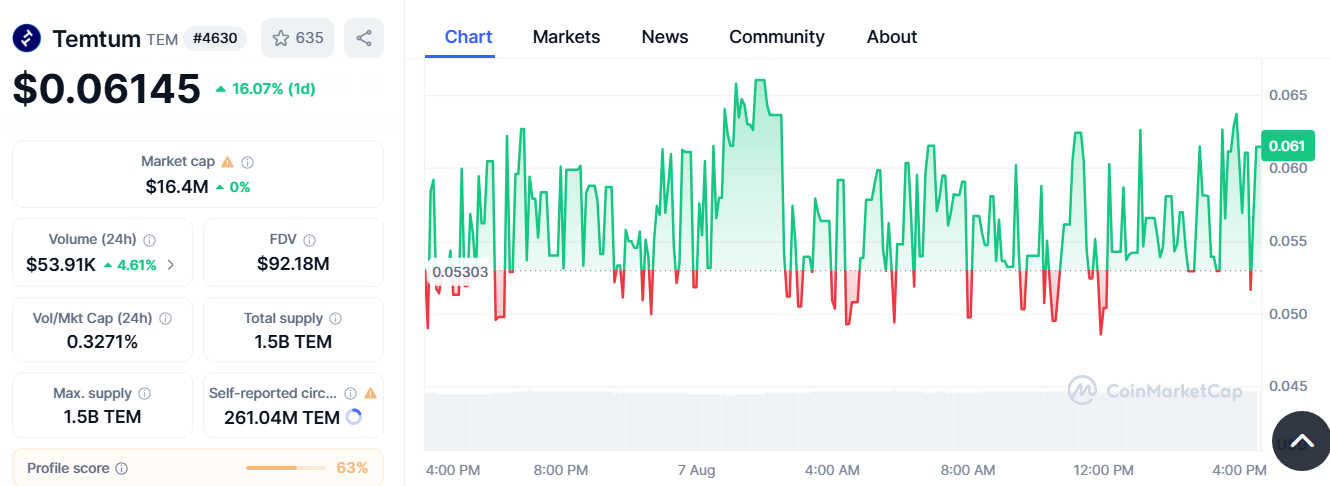
Each touch on the support has been followed by a bounce, and the current candlestick pattern suggests that the price has again interacted with the base of this structure. While overall volume remains modest at $53.71K over the past 24 hours, price has seen a notable +20.12% daily gain, positioning the asset at $0.06370 as of the latest close. This interaction comes ahead of the upcoming earnings report scheduled for August 8, which could introduce short-term volatility.

Momentum Builds as METIS Approaches Triangle Apex with Bullish Signals

Momentum indicators are confirming the price structure’s relevance. The weekly RSI, now fully bottomed, is forming a higher low, which reinforces the bullish divergence present on the chart. RSI divergence appears more defined when paired with price’s consistent defense of the ascending trendline. This technical behavior is historically associated with momentum shifts. 

The weekly RSI is fully bottomed and putting in a higher low right now on $TEM .

Price at the uptrend support as well.

I'm telling you, this is screaming 10/10 buy right now technically speaking.

Tail risk is ER on Friday (8/8) morning, but the chart does the talking for us. pic.twitter.com/9om2Sql6mO

— Chris (@StonkChris) August 7, 2025

More importantly, the stochastic indicator at the bottom shows a similar upturn, supporting RSI’s direction. However, the formation remains within a consolidation range, and a breakout would require confirmation by volume and candle closure above the triangle.

The triangular formation has now reached its apex, with breakout projections identified using Fibonacci extensions. Based on the charted levels, the 1.618 extension target is set at $124.01, while the 2.0 extension aligns with the $144.86 mark. These values, though not predictive, define the technical breakout zones that would be activated upon confirmation. So far, the price structure remains inside the formation but is showing early breakout behavior with the current green candle.

Temtum Steady as Low Float Fuels Volatility Ahead of Earnings

From a market structure perspective, Temtum’s market cap holds steady at $16.4 million with a fully diluted valuation of $95.55 million. Circulating supply is self-reported at 261.04 million TEM, a fraction of the 1.5 billion maximum supply. 

The high volatility and the sudden price swings could be attributed to this relatively low float. Moreover, its volume-to-market-cap ratio per day is 0. 3271% indicating moderate activity even with the thin order book. As the week wears on, the focus is on the level of prices and as well as the upcoming earnings release.

0
0

Disclaimer: The content of this article solely reflects the author's opinion and does not represent the platform in any capacity. This article is not intended to serve as a reference for making investment decisions.

Understand the market, then trade.
Bitget offers one-stop trading for cryptocurrencies, stocks, and gold.
Trade now!

You may also like

Nineteen out of twenty, Chair Waller again failed to deliver the Fed dot plot “assignment”

Federal Reserve Chairman Waller has twice refused to enter his interest rate forecasts on the dot plot, bluntly stating that the tool is "of no use for policy implementation." The dot plot, which has been in operation since 2011 and is published four times a year to show officials' interest rate expectations, is an important reference for the market to assess the direction of monetary policy. However, its lack of consensus, anonymity, and the participation of non-voting governors have long been criticized. Previous chairs have had varying attitudes toward the tool, but Waller's stance is the toughest.

华尔街见闻2026/09/16 23:06

Overnight US Stock Market | Federal Reserve Raises Interest Rates by 25 Basis Points as Expected, All Three Major Indexes Close Lower, SpaceX (SPCX.US) Rises Over 5%

At market close, the Dow Jones Industrial Average fell by 630.56 points, or 1.21%, to 51,462.55 points; the S&P 500 Index dropped 33.51 points, or 0.44%, to 7,552.22 points; and the Nasdaq Composite Index declined 3.15 points, or 0.01%, to 25,978.42 points.

智通财经2026/09/16 22:41
Overnight US Stock Market | Federal Reserve Raises Interest Rates by 25 Basis Points as Expected, All Three Major Indexes Close Lower, SpaceX (SPCX.US) Rises Over 5%

Overseas investors reduced their holdings of U.S. Treasury bonds by $50.4 billion in July; both Japan and China cut holdings, while the UK increased holdings against the trend

Data released by the U.S. Treasury on Wednesday shows that in July, the amount of U.S. Treasury bonds held by overseas investors significantly decreased, dropping by $50.4 billion from June to $9.25 trillion, marking the lowest level since October last year.

智通财经2026/09/16 22:41
Overseas investors reduced their holdings of U.S. Treasury bonds by $50.4 billion in July; both Japan and China cut holdings, while the UK increased holdings against the trend