

Date: Thu, Nov 06, 2025 | 09:00 AM GMT
The cryptocurrency market is showing minor signs of relief after a sharp sell-off earlier this week that briefly pushed Bitcoin (BTC) to the $98K region before rebounding to $103K. This recovery is offering room for select altcoins to regain some green momentum — including COTI, the native token powering Coti’s privacy Layer 2 on Ethereum.
COTI is trading slightly higher today, though still down 41% over the past month. But despite this extended decline, its current technical structure suggests that the token could be approaching a potential bullish reversal phase.
 Source: Coinmarketcap
Falling Wedge Pattern in Play
On the weekly chart, COTI is forming a falling wedge — a well-known bullish reversal pattern that typically forms during prolonged downtrends when selling pressure begins to weaken.
The latest correction pushed COTI down to the wedge’s lower boundary near $0.0251, a level that once again acted as strong support. From there, the token has rebounded to around $0.0277, indicating that buyers are stepping in to defend this zone.
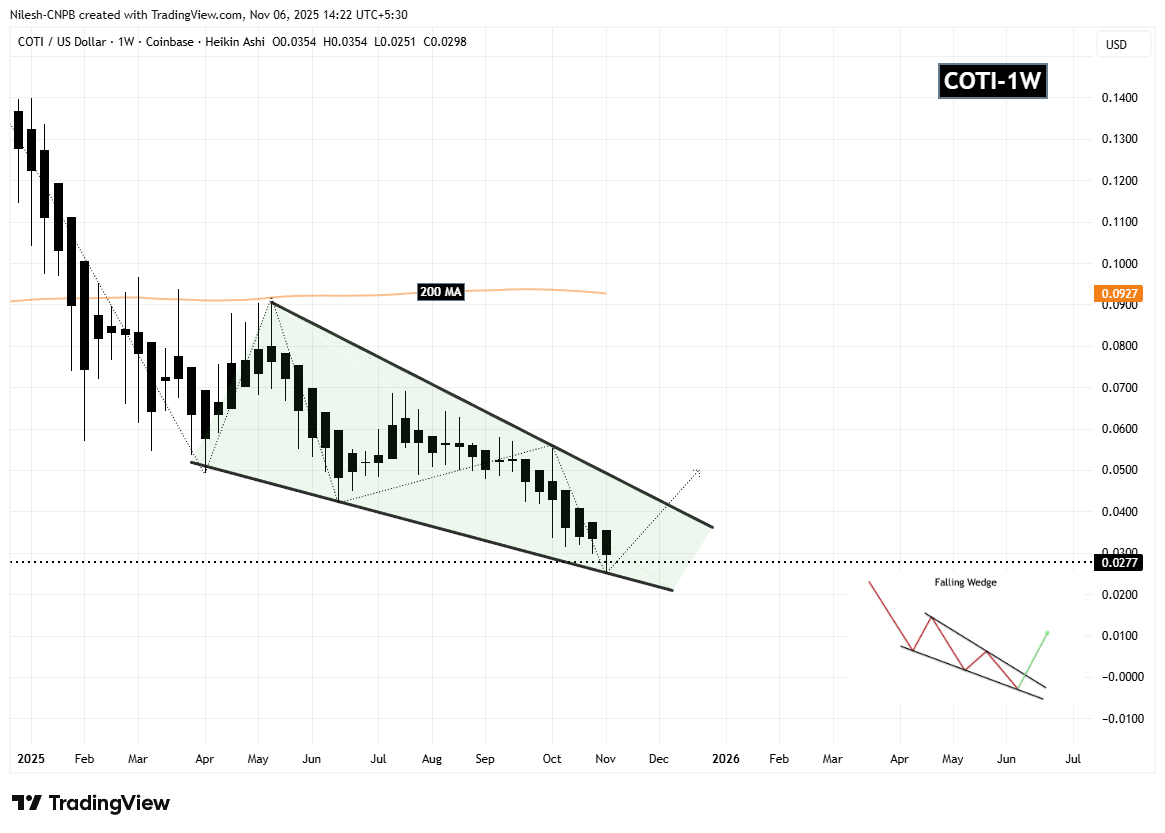 Coti (COTI) Weekly Chart/Coinsprobe (Source: Tradingview)
This repeated defense of the wedge’s support trendline is a positive signal and could serve as the structural foundation for an upcoming reversal.
What’s Next for COTI?
If COTI continues to hold above the wedge’s lower trendline, the next key step would be a move toward the upper resistance line of the wedge. A successful breakout above this level would confirm a bullish reversal and could trigger a stronger upside recovery.
The primary technical target in such a scenario would be the 200-day Moving Average (MA) near $0.0927, which stands as a major resistance and trend confirmation level.
However, traders should monitor the wedge support closely. A breakdown below the lower trendline could invalidate the bullish setup and expose COTI to deeper downside before any meaningful rebound takes shape.
For now, the chart leans cautiously optimistic — the falling wedge remains intact, and buyers are showing signs of defending key support.


