
Solana price signals strength after successful $120 bullish retest

Solana price shows early bullish strength after reclaiming and retesting $120 support, signaling a failed auction. The door’s now open for a potential upside expansion.
- Solana confirms a bullish retest above $120 support.
- Failed auction below support signals seller exhaustion.
- Bollinger Band compression hints at upside expansion.
Solana (SOL) price is displaying constructive technical behavior after completing a successful bullish retest of the $120 support level. Following a sharp reclaim of this region and acceptance above value, price action now suggests that downside attempts have been rejected.
With demand clearly present above support and volatility compressing, Solana may be preparing for an upside expansion toward higher value levels.
Solana price key technical points
- $120 support reclaimed and successfully retested, confirming buyer strength.
- Failed auction below support signals seller exhaustion.
- Bollinger Band compression suggests a volatility expansion is approaching.
 XRPUSDT (4H) Chart, Source:
TradingView
XRPUSDT (4H) Chart, Source:
TradingView
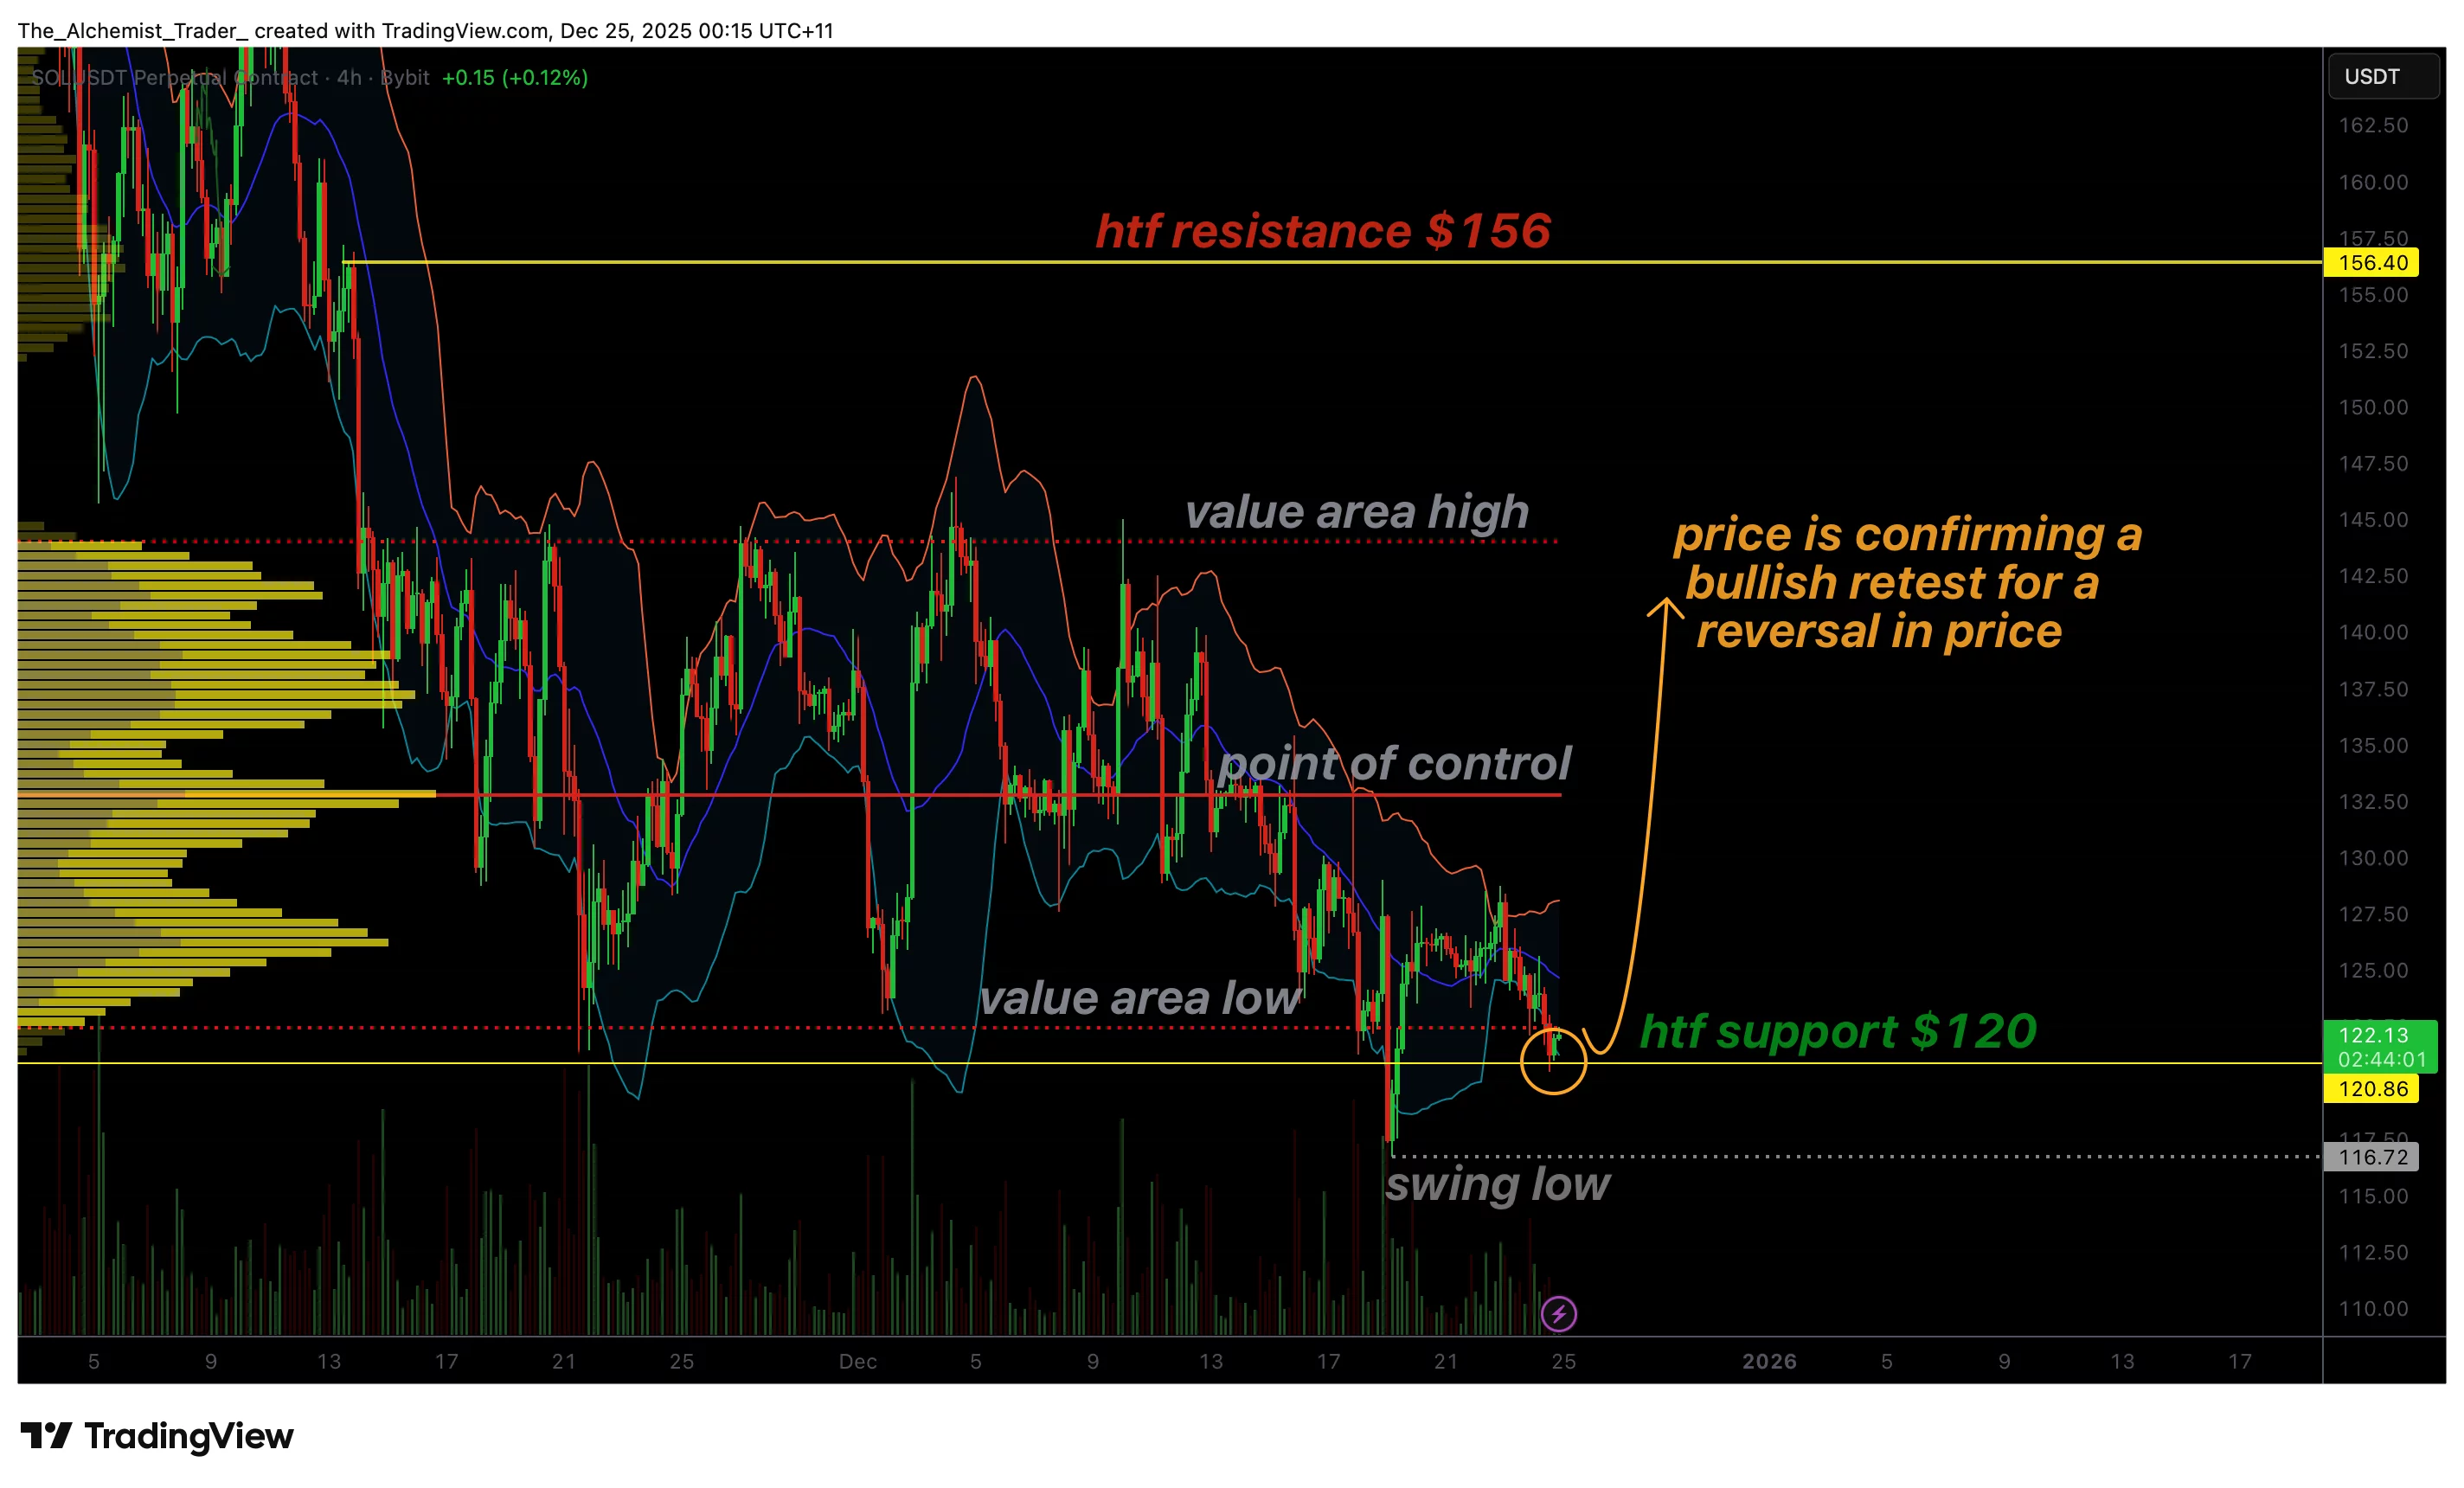
Recent Solana price action indicates an important structural shift at lower time frames. After briefly trading below $120, price quickly reclaimed this level alongside the Value Area High, producing an impulsive bullish candle. This behavior confirms a failed auction, where sellers were unable to establish acceptance below support due to a lack of follow-through selling pressure.
Failed auctions are significant because they often indicate that the market has tested lower prices and rejected them. In Solana’s case, this rejection led to a rapid move back into value, shifting short-term control back toward buyers.
Following the reclaim, price action returned to the $120 region, where it printed a bullish reaction candle, confirming the level as newly established support. This bullish retest is a critical validation step, as strong trends often begin with a reclaim followed by a successful retest that holds on a closing basis.
From a market-structure perspective, holding above $120 keeps Solana positioned favorably for continuation. This level now represents both high-time-frame support and a structural pivot that separates bearish continuation from bullish rotation. As long as price remains above this region, downside risk is limited, and higher targets remain in play.
That upper boundary sits near the Value Area High, which becomes the next logical upside objective. A rotation toward this region would represent a full auction move from support back to resistance, consistent with balanced market behavior following a failed auction.
Volatility dynamics further strengthen the bullish case. The Bollinger Bands are currently compressing, a condition that historically precedes expansion moves. Compression reflects declining volatility and market indecision, but once expansion begins, price often moves decisively. Given the successful bullish retest at $120, the probability favors an upside expansion as long as support remains intact.
From a price-action perspective, demand above $120 is evident. Buyers have defended this region decisively, while sellers have failed to push price lower despite multiple opportunities. This shift in behavior suggests that bearish momentum has weakened, and control is gradually transitioning back to the bulls, a backdrop that aligns with Solana’s revenue narrowing the gap with Ethereum and growing investor interest in structured yield platforms like SolStaking.
That said, confirmation remains essential. While the structure is constructive, sustained upside will require follow-through and continued acceptance above $120. A loss of this level would invalidate the bullish retest and reopen downside risk.
Solana price action: What to expect
As long as Solana holds above the $120 support and remains above the Value Area Low, the probability of an upside expansion increases. A move toward the Value Area High is the next likely target, with Bollinger Band expansion potentially accelerating the move.
Failure to hold $120 would negate the bullish setup and shift focus back to consolidation or downside risk.
Disclaimer: The content of this article solely reflects the author's opinion and does not represent the platform in any capacity. This article is not intended to serve as a reference for making investment decisions.
You may also like
XRP Pundit: First Thing You Should Do When You Become a Crypto Millionaire
 VIPTradFi Focus: Where Does the RWA Market Stand Today?
1. Crypto outperformed traditional equity indexes following the rate hike, but elevated interest rates remain a key constraint on cross-asset allocation. From September 12 to 18, BTC, ETH, and SOL gained 4.83%, 3.84%, and 9.96%, respectively, while the S&P 500 edged down 0.08%. The U.S. Dollar Index rose 1.11%, and the 10-year U.S. Treasury yield closed at approximately 4.998%. Improving risk appetite is therefore coexisting with elevated discount rates, raising the bar for RWA allocation: investors need to compare not only returns on the underlying assets, but also on-chain liquidity and collateral efficiency. 2. Growth in tokenized equities is occurring even as the overall RWA market remains under pressure. As of September 18, Distributed Asset Value across RWAs stood at $38.503 billion, down 1.13% week over week, while tokenized equities reached $3.056 billion, up 6.03%. This week's data are better explained by capital reallocating across different RWA segments than by a broad-based expansion of the entire RWA market. 3. For exchanges, the opportunity lies in connecting spot holdings, collateral, and derivatives. Reality's distributed asset value stands at approximately $155 million, while eligible rTokens can already be used within Bitget's UTA margin framework. Across CoinGlass's verifiable sample of 177 TradFi instruments, open interest reached approximately $11.498 billion, up 2.06% week over week, even as weekly trading volume declined 7.60%. The medium-term opportunity remains intact, but deeper utilization will depend on liquidity, collateral use, and sustained trading activity. 4.Assets to watch: BTC, ETH, SOL, NEAR, ZEC, gold, tokenized U.S. equities, COST. 5.Key metrics to watch: rToken collateral utilization, the durability of TradFi open interest and trading volume, and next week's employment and consumer data.

Gold prices fall Rs 1,331/10 gram, silver dips Rs 1,600/kg as Mideast tensions outweigh oil fall: Key levels to track
Strategists Say Market's ‘Wall of Worry' Is Healthy, Not a Warning Sign

Crypto prices
More


