

Shiba Inu price today trades near $0.00000601 after consolidating above the $0.000006 support level following last week’s crash to $0.000005. The stabilization comes alongside a dramatic spike in burn activity and significantly reduced spot outflows, though the token remains trapped within a year-long descending channel.
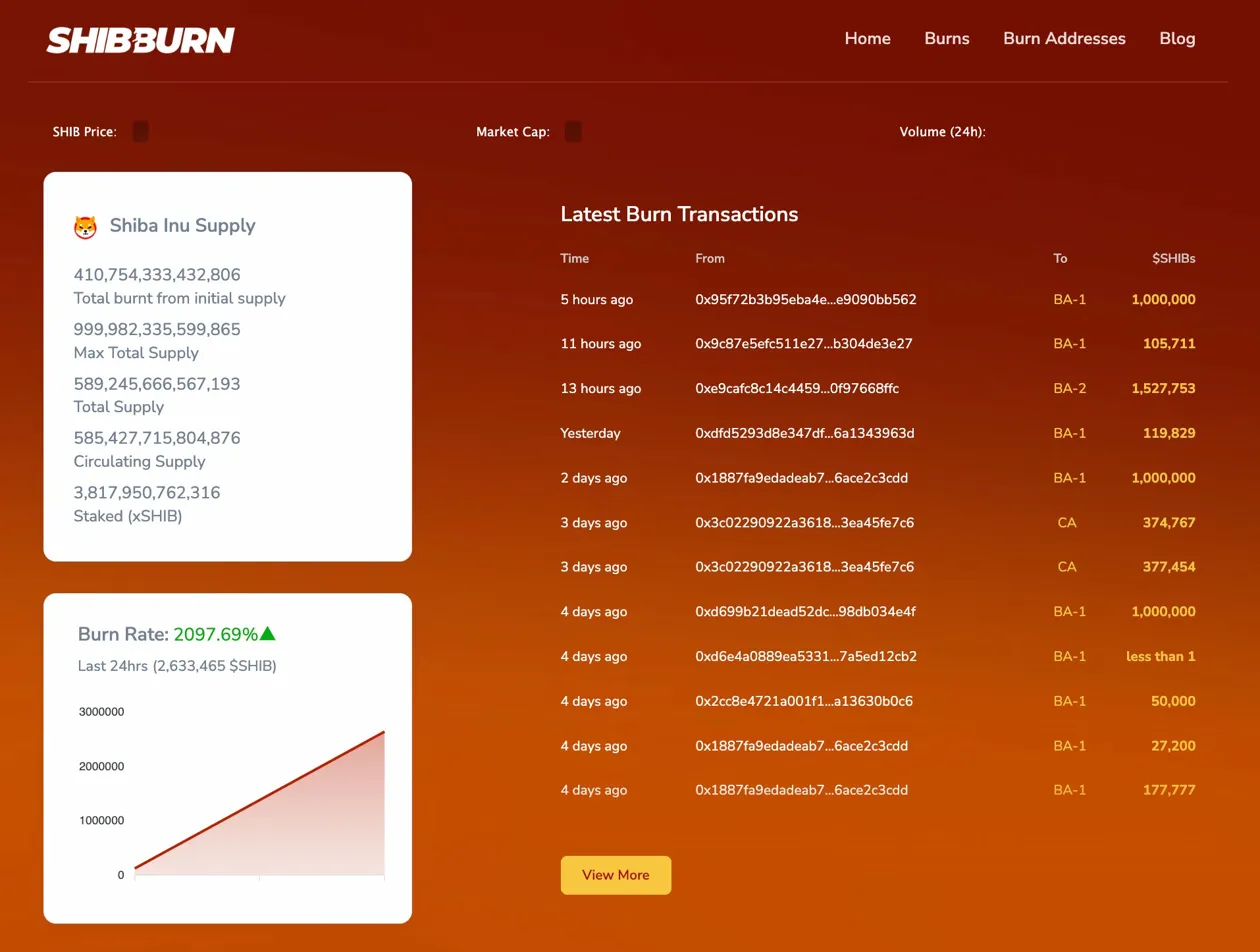
Shibburn data reveals a dramatic surge in burn activity, with the burn rate jumping 2,097.69% in the past 24 hours. The community sent 2.63 million SHIB to dead wallets, a significant increase from the sub-million daily burns seen during the crash.
Total supply has been reduced to 589.24 trillion SHIB from an initial 1 quadrillion, with 410.75 trillion tokens burned since launch. Circulating supply sits at 585.42 trillion with 3.81 trillion staked as xSHIB.
Recent burn transactions show consistent activity with 1 million SHIB burns appearing multiple times over the past few days. While these amounts are small relative to total supply, the acceleration in burn rate suggests community engagement is returning after the capitulation phase.
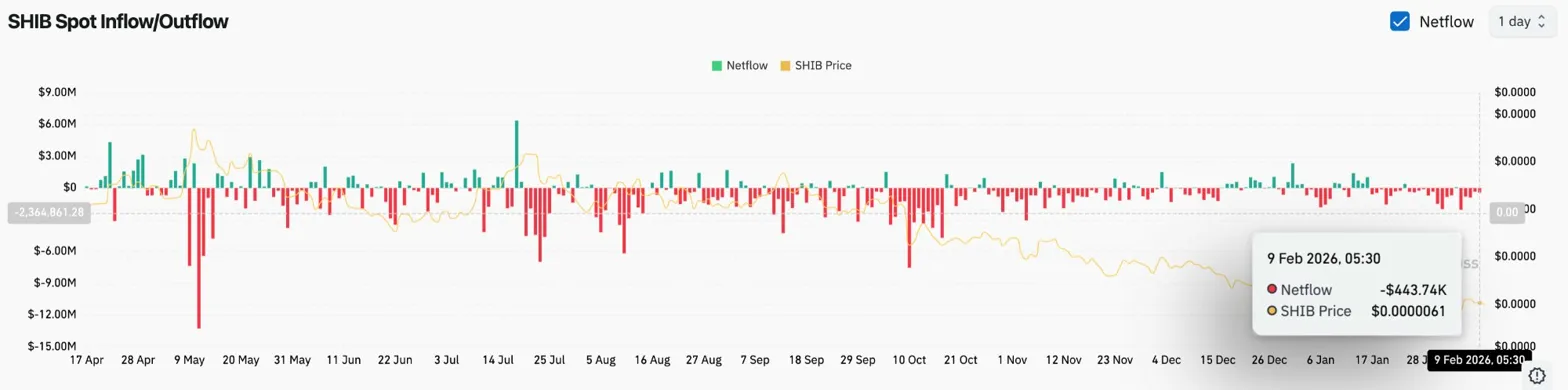
Coinglass data shows just $443.74K in spot outflows on February 9, a dramatic reduction from the multi-million dollar outflows seen during the crash. The moderating outflows suggest that near-term selling pressure may be exhausting.
The flow pattern through February shows a clear trajectory from heavy outflows during the crash to progressively smaller outflows during consolidation. When outflows moderate alongside stable prices, it indicates that weak hands have largely capitulated.
The contrast with larger cap tokens like XRP, which saw $19.57 million in outflows on the same day, highlights SHIB’s relative resilience during the recent market weakness. Smaller outflows at lower prices suggest the remaining holder base has stronger conviction.
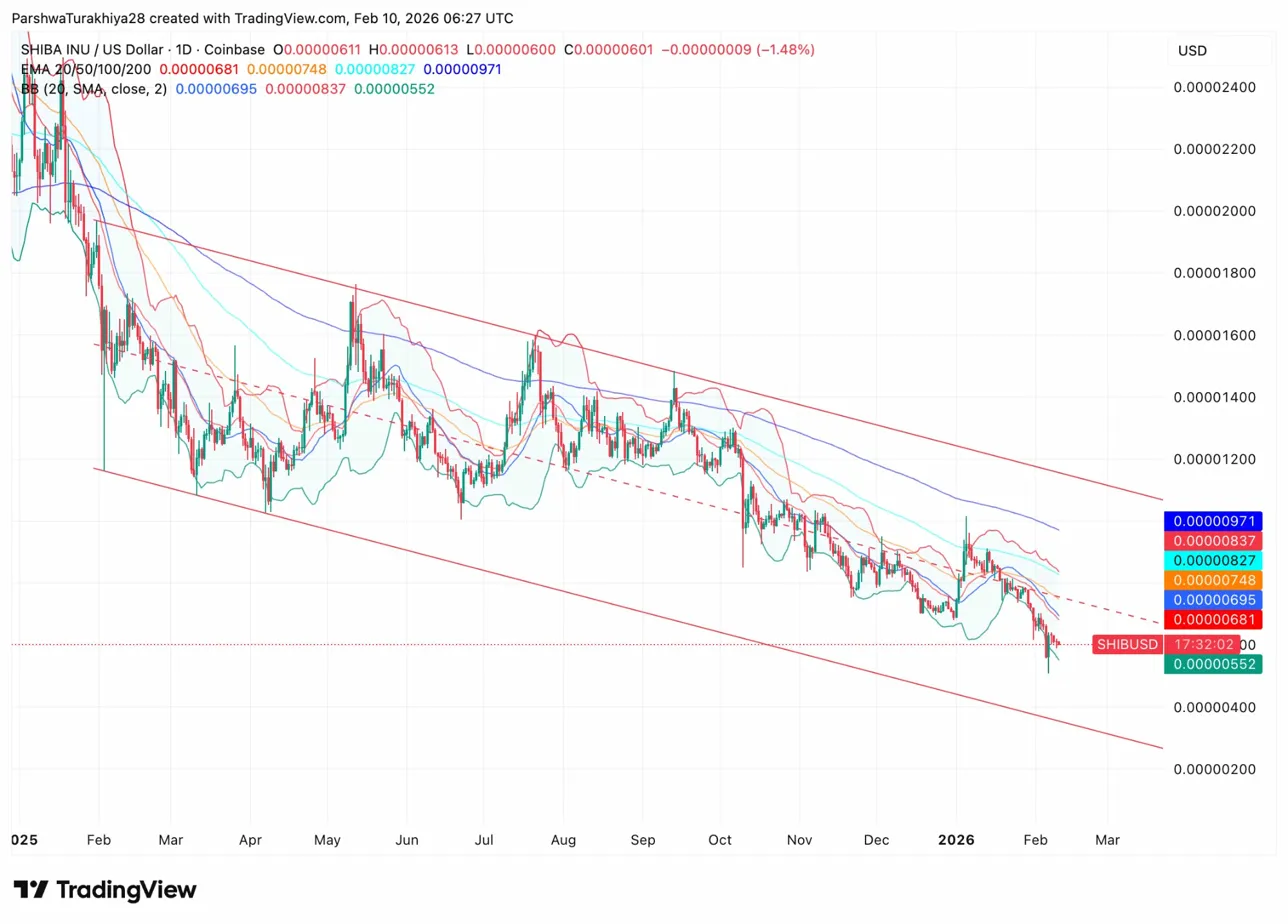
On the daily chart, Shiba Inu trades within a descending channel that has contained price action since early 2025. The channel resistance currently runs through approximately $0.0000068, while support sits near $0.000004.
Price trades below all four major EMAs with a bearish structure intact. The 20 day EMA sits at $0.00000681, the 50 day at $0.00000748, the 100 day at $0.00000827, and the 200 day at $0.00000971.
The Bollinger Bands show the 20 day SMA at $0.00000695 with the lower band at $0.0000055 providing immediate support. Current price near $0.0000060 sits between these levels, reflecting the ongoing consolidation.
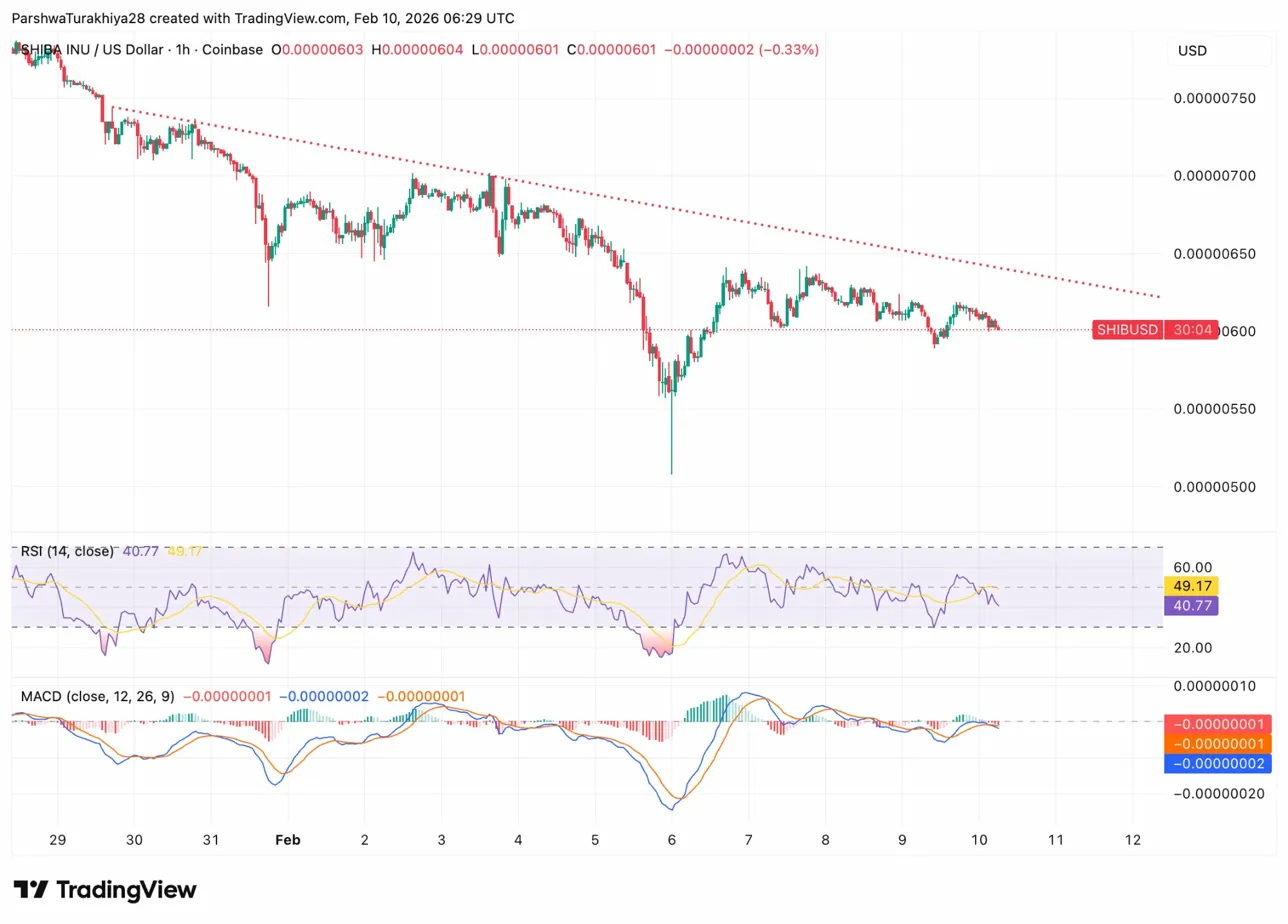
On the hourly chart, SHIB trades below a descending trendline from the January 29 high that currently runs through $0.0000065. This trendline has capped every rally attempt since the crash began.
RSI sits at 40.77, recovering from deeply oversold levels but still below neutral. The indicator shows stabilization without strong directional conviction. MACD remains negative but has stopped declining, suggesting downside momentum is fading.
The February 6 crash low at $0.000005 established support that has held through subsequent tests. Price has formed a higher low pattern on the hourly timeframe, with each pullback finding support at progressively higher levels.
The trend remains bearish while price trades within the descending channel, but moderating outflows and surging burns suggest conditions for stabilization are forming.
- Bullish case: A daily close above $0.00000681 would reclaim the 20 day EMA and break the descending trendline resistance. The 2,097% burn rate increase and $443K moderating outflows signal community conviction returning.
- Bearish case: A close below $0.0000055 would break Bollinger Band support and target the $0.0000040 demand zone at the channel floor. Without a catalyst to shift meme coin sentiment, the bearish structure remains intact.



