
Ether’s hidden strength: Why institutional demand points to $2.4K

Key takeaways:
Ether exchange-traded funds saw $71 million in inflows, signaling strong institutional appetite.
Weekly decentralized exchange volume doubled to $20 billion, narrowing the revenue gap with Solana.
Ether (ETH) price failed to sustain levels above $2,000 on Thursday, leaving traders to weigh the potential catalysts for a market turnaround. While optimism has waned since the crash to $1,745 on Friday, both exchange-traded fund (ETF) flows and ETH derivatives metrics are showing early signs of a reversal.
Traders now question if there is enough momentum for a bounce back toward $2,400.
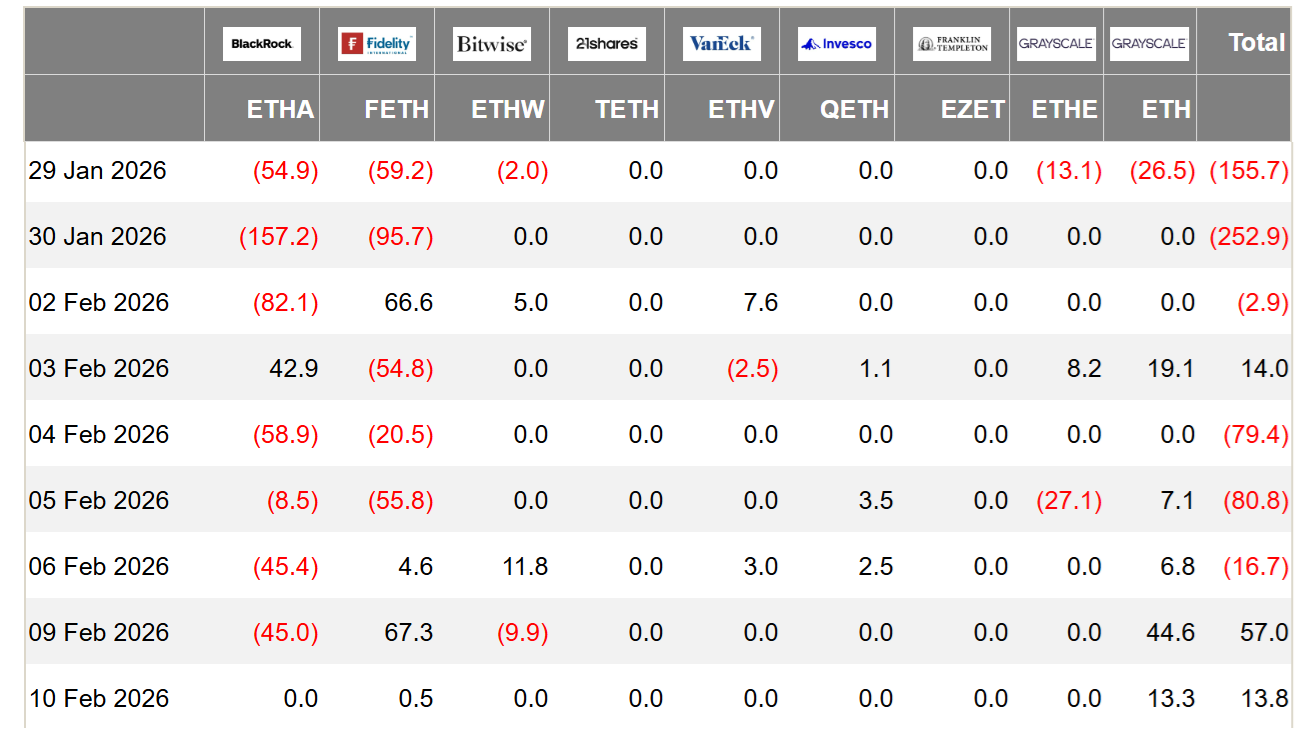 US-listed Ether ETFs' daily net flows, USD. Source: Farside Investors
US-listed Ether ETFs recently broke a three-day streak of outflows, attracting $71 million in fresh capital between Monday and Tuesday. Crucially, assets under management have stabilized at $13 billion, which is sufficient to maintain institutional interest. Ether ETFs currently average over $1.65 billion in daily trading volume, a level of liquidity that enables participation by the world’s largest hedge funds.
To put Ether ETFs in perspective, the State Street Energy Select Sector SPDR ETF (XLE US)— the largest in the US energy sector — trades an average of $1.5 billion per day. That instrument tracks a combined $2 trillion market capitalization across companies such as Exxon (XOM US), Chevron (CVX US), ConocoPhillips (COP US), The Williams Companies (WMB), and Kinder Morgan (KMI US).
ETH metrics and ETF inflows signal potential market recovery
While institutional appetite for Ether ETF trading is a positive indicator, it does not guarantee that demand for ETH derivatives is inherently bullish.
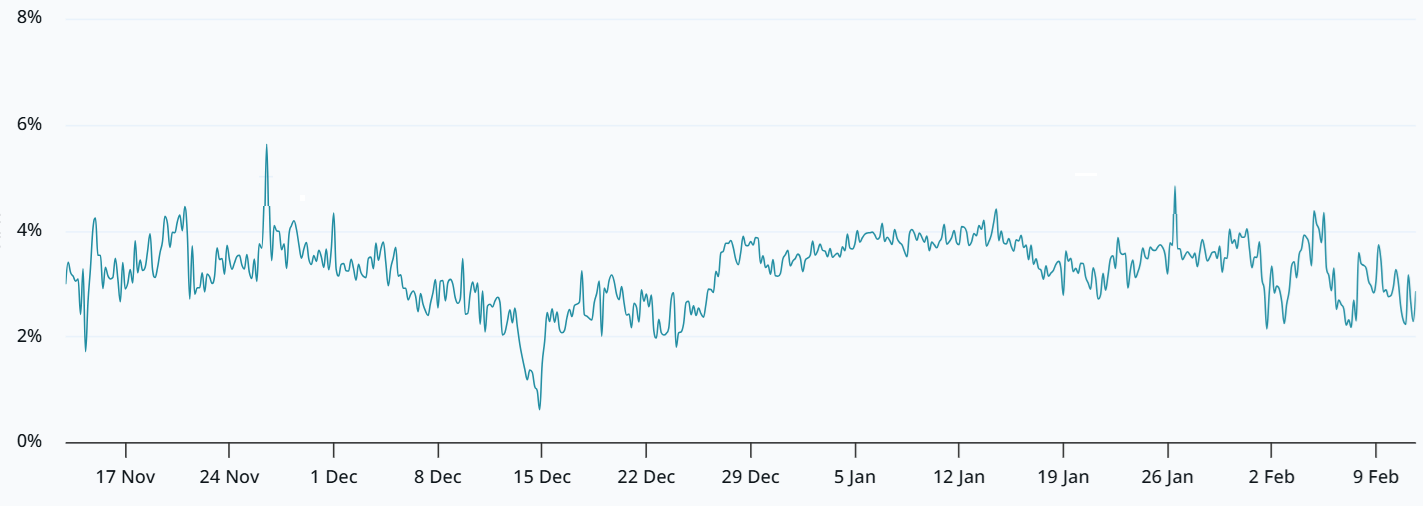 ETH 2-month futures basis rate. Source:
On Wednesday, the annualized premium (basis rate) of ETH futures remained below the 5% neutral threshold. This lack of demand for bullish leverage has been a constant theme for the past three months. However, the indicator has stabilized at 3%, even as the ETH price hit its lowest level in nine months. These derivatives markets are displaying moderate resilience, which remains an encouraging sign for Ether investors.
Related:
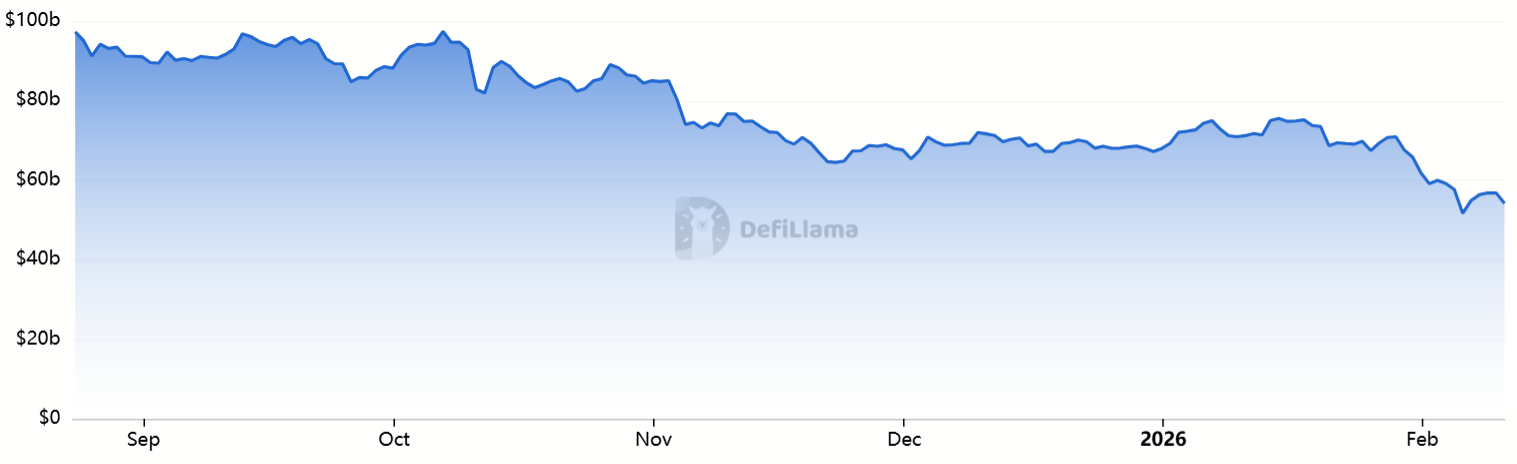 Ethereum Total Value Locked, USD. Source: DefiLlama
Ether’s price weakness has driven Ethereum’s Total Value Locked (TVL) to $54.2 billion, down from $71.2 billion one month prior, according to DefiLlama data. Reduced deposits in the network’s smart contracts represent a major risk, as lower chain fees diminish the native staking yield. Moreover, Ethereum’s supply burn mechanism remains dependent on excessive demand for blockchain processing.
Despite these worsening conditions, demand for Ethereum decentralized applications (DApps) has been gradually improving throughout 2026.
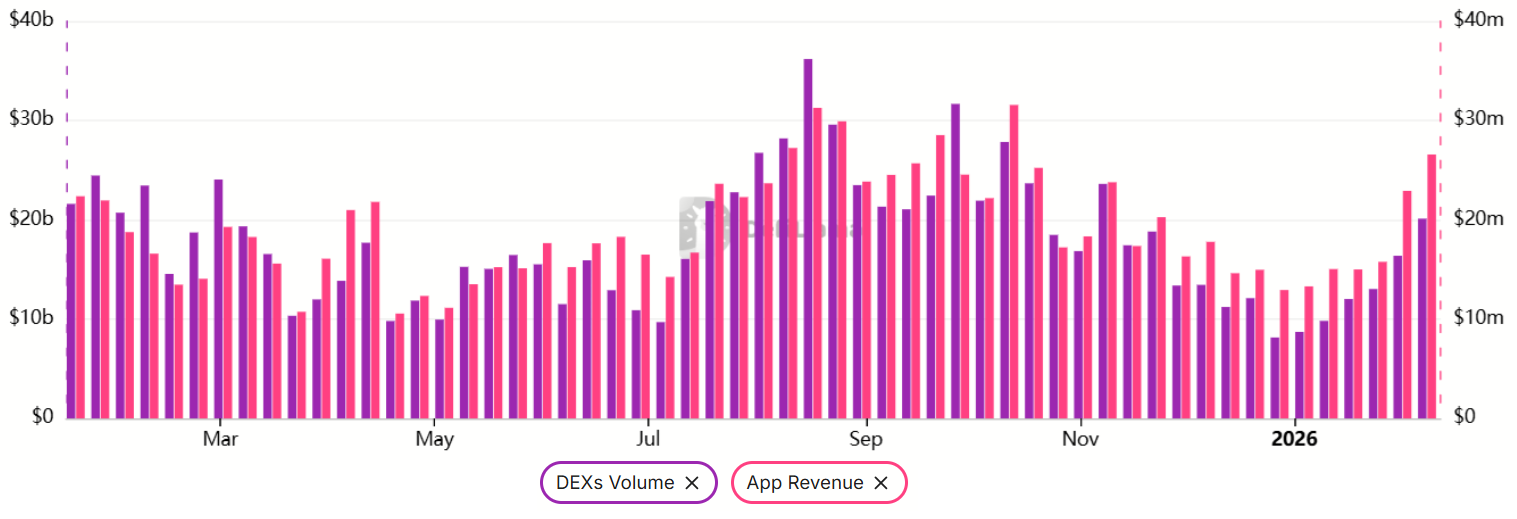 Ethereum 7-day DEX volumes (left) vs. DApps revenue (right), USD. Source: DefiLlama
Weekly decentralized exchange (DEX) volumes on the Ethereum network surged to $20 billion, up from $9.8 billion one month prior. This increased activity caused DApps revenue to reach $26.6 million in the seven days ending Feb. 8, providing a healthy indicator of ETH demand. While Solana remained the clear leader with $31.1 million in weekly DApps revenue, the gap between the two networks is narrowing.
Those monitoring Ether price performance exclusively fail to see that ETH onchain metrics and derivatives have displayed resilience, especially as inflows into Ether ETFs resumed. While it might take a couple of weeks for investors to fully regain confidence, there are strong indicators that a near-term rally toward $2,400 is possible.
Disclaimer: The content of this article solely reflects the author's opinion and does not represent the platform in any capacity. This article is not intended to serve as a reference for making investment decisions.
You may also like
US Treasury yield curve approaches inversion! Is the bond market questioning the outlook for the US economy?
The U.S. Treasury yield curve is rapidly approaching the inversion threshold—the spread between the 10-year and 2-year yields has narrowed to historic lows, and bank stocks have responded with a technical correction. This warning signal, regarded as a "hard rule" for recession, is tearing apart market consensus: some are betting the curve will soon invert, while others firmly believe economic resilience will mitigate the risk. Amid ongoing Federal Reserve rate hikes, the outcome of this bond market game may reshape the narrative logic of the entire asset market.

From ICU to KTV! The Polarized "AI Narrative" Leaves Investors "Exhausted"
In just two weeks, the Nasdaq 100 experienced an extreme rollercoaster: first losing $600 billion in market value due to “AI threat” concerns, then rebounding to reclaim $3 trillion thanks to the viral Meta assistant. Analysts believe that market sentiment is swinging violently between fear and greed, detached from fundamentals. The turmoil has driven Nvidia’s valuation to a ten-year low, intensified the bull-bear divide, and the high volatility driven by narratives has become a long-term norm for investors. This week, Micron will release its financial report; regardless of the outcome, the sharp swings in market sentiment are unlikely to subside.
Weekly Preview: Micron (MU.US) earnings test the quality of AI infrastructure, OpenAI and White House AI meeting resonance, PCE and Nonfarm Payrolls set the tone for October interest rates
This week, the market's focus will shift from politics and product launches to financial reports and macroeconomic data.
"Over 5% 10-Year US Treasury Yield" Fails to Crush AI Investment Frenzy—Is the Real "AI Kill Line" an Inverted Yield Curve?
The bond market is gradually sending warning signals to the economy, indicating that the Federal Reserve's series of interest rate hikes will begin to shift market sentiment, making people increasingly concerned that the US economy may fall into stagnation.

Crypto prices
More


