
Rackspace Surges 217% From Lows As Stock Tests Key Long-Term Trend Barrier

Rackspace Technology, Inc (NASDAQ:RXT) has staged a sharp technical recovery, with shares climbing roughly 217% from their recent low near $0.40 to about $1.27, bringing the stock directly into contact with a critical long-term trend level. The move has been accompanied by a major expansion in trading activity, signaling a measurable shift in market participation.
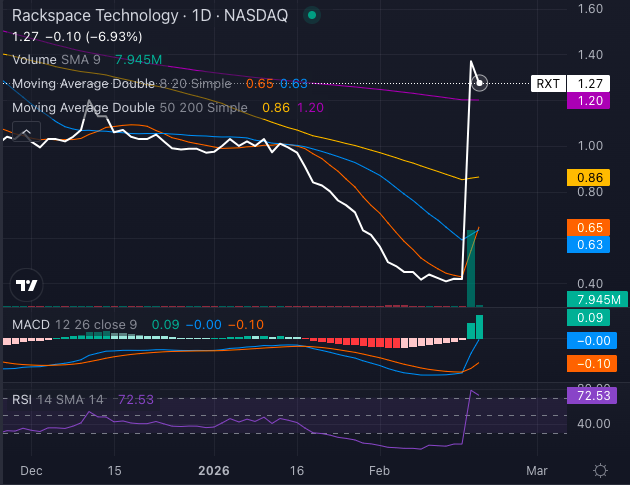
Chart created using Benzinga Pro
RXT stock is now testing its 200-day moving average near $1.20, a level widely used to define long-term trend direction. Stocks trading below this level are generally considered to be in long-term downtrends, while sustained moves above it often signal structural reversals.
Volume Surge Confirms Elevated Market Participation
Rackspace's average daily trading volume has risen to approximately 7.9 million shares, based on its 9-day volume average. This marks a sharp increase from prior months, when daily volume frequently remained below 3 million shares.
The recent surge included multiple sessions with volume significantly exceeding that average, indicating sustained investor engagement rather than isolated trading activity. Rising volume alongside rising price is a key technical signal that confirms strengthening trend conditions.
Momentum Confirms Strong Trend
Momentum indicators have also shifted decisively. Rackspace's Relative Strength Index (RSI) recently climbed above 72, its highest level in months. RSI readings above 70 indicate strong upward momentum, reflecting accelerated buying activity.
At the same time, the stock has reclaimed both its 20-day moving average at $0.63 and its 50-day moving average at $0.86. RXT stock now stands approximately 95% above the 20-day average and 48% above the 50-day average, confirming rapid short- and medium-term trend acceleration.
Long-term trend level now acting as technical inflection point
The 200-day moving average at $1.20 represents the final major long-term resistance level. Rackspace's recovery from deeply oversold levels to this threshold reflects a complete shift in technical structure over recent months.
Price, trading volume, and momentum indicators are all strengthening at the same time. Rackspace is now testing its 200-day moving average, a key level that often determines a stock's long-term direction.
Photo: Shutterstock
Disclaimer: The content of this article solely reflects the author's opinion and does not represent the platform in any capacity. This article is not intended to serve as a reference for making investment decisions.
You may also like
Meta AI Director Alexandr Wang: Why I Want to Create Muse
Muse reached 2.8 million downloads within 12 days of launch, surpassing ChatGPT's performance in the same period, and set a single-day US record with 264,000 downloads—driving Meta's market value up by $234 billion. Behind this is an open letter from Chief AI Officer Alexandr Wang discussing "human desires," and the $14.3 billion acquisition by Zuckerberg that was once mocked as "crazy": now, it may be the most worthwhile talent acquisition in Silicon Valley history.
Crypto ETF Flows Are Near Record Highs: 5 Altcoins Poised for Fresh Institutional Demand
NEAR Protocol Prints Inverse H&S Breakout — $6.00 Target in Focus
Altseason Setup Is Taking Shape: 5 Altcoins to Consider Before the Next Market Surge
Crypto prices
More


