
Bitcoin bottom fractal calls for 130% rally, but is the model valid in 2026?

A Bitcoin (BTC) bottom signal that appeared in 2023, ahead of a 130% rally in 2024, has flashed again this week, raising the possibility that the price is nearing another bullish inflection point.
At the same time, the broader data of liquidity, exchange-traded fund (ETF) flows, and macroeconomic data changes the environment from two years ago, suggesting that the path forward may not mirror the previous cycle’s.
BTC bottom trigger appears without strong follow-through
Data aggregator Swissblock noted that Bitcoin has now logged 25 consecutive days in its “extreme high risk” zone, the longest stretch on record and above the 23-day peak seen in 2023. Historically, an extended stay in this zone has aligned with late-stage drawdowns or a bottom signal.
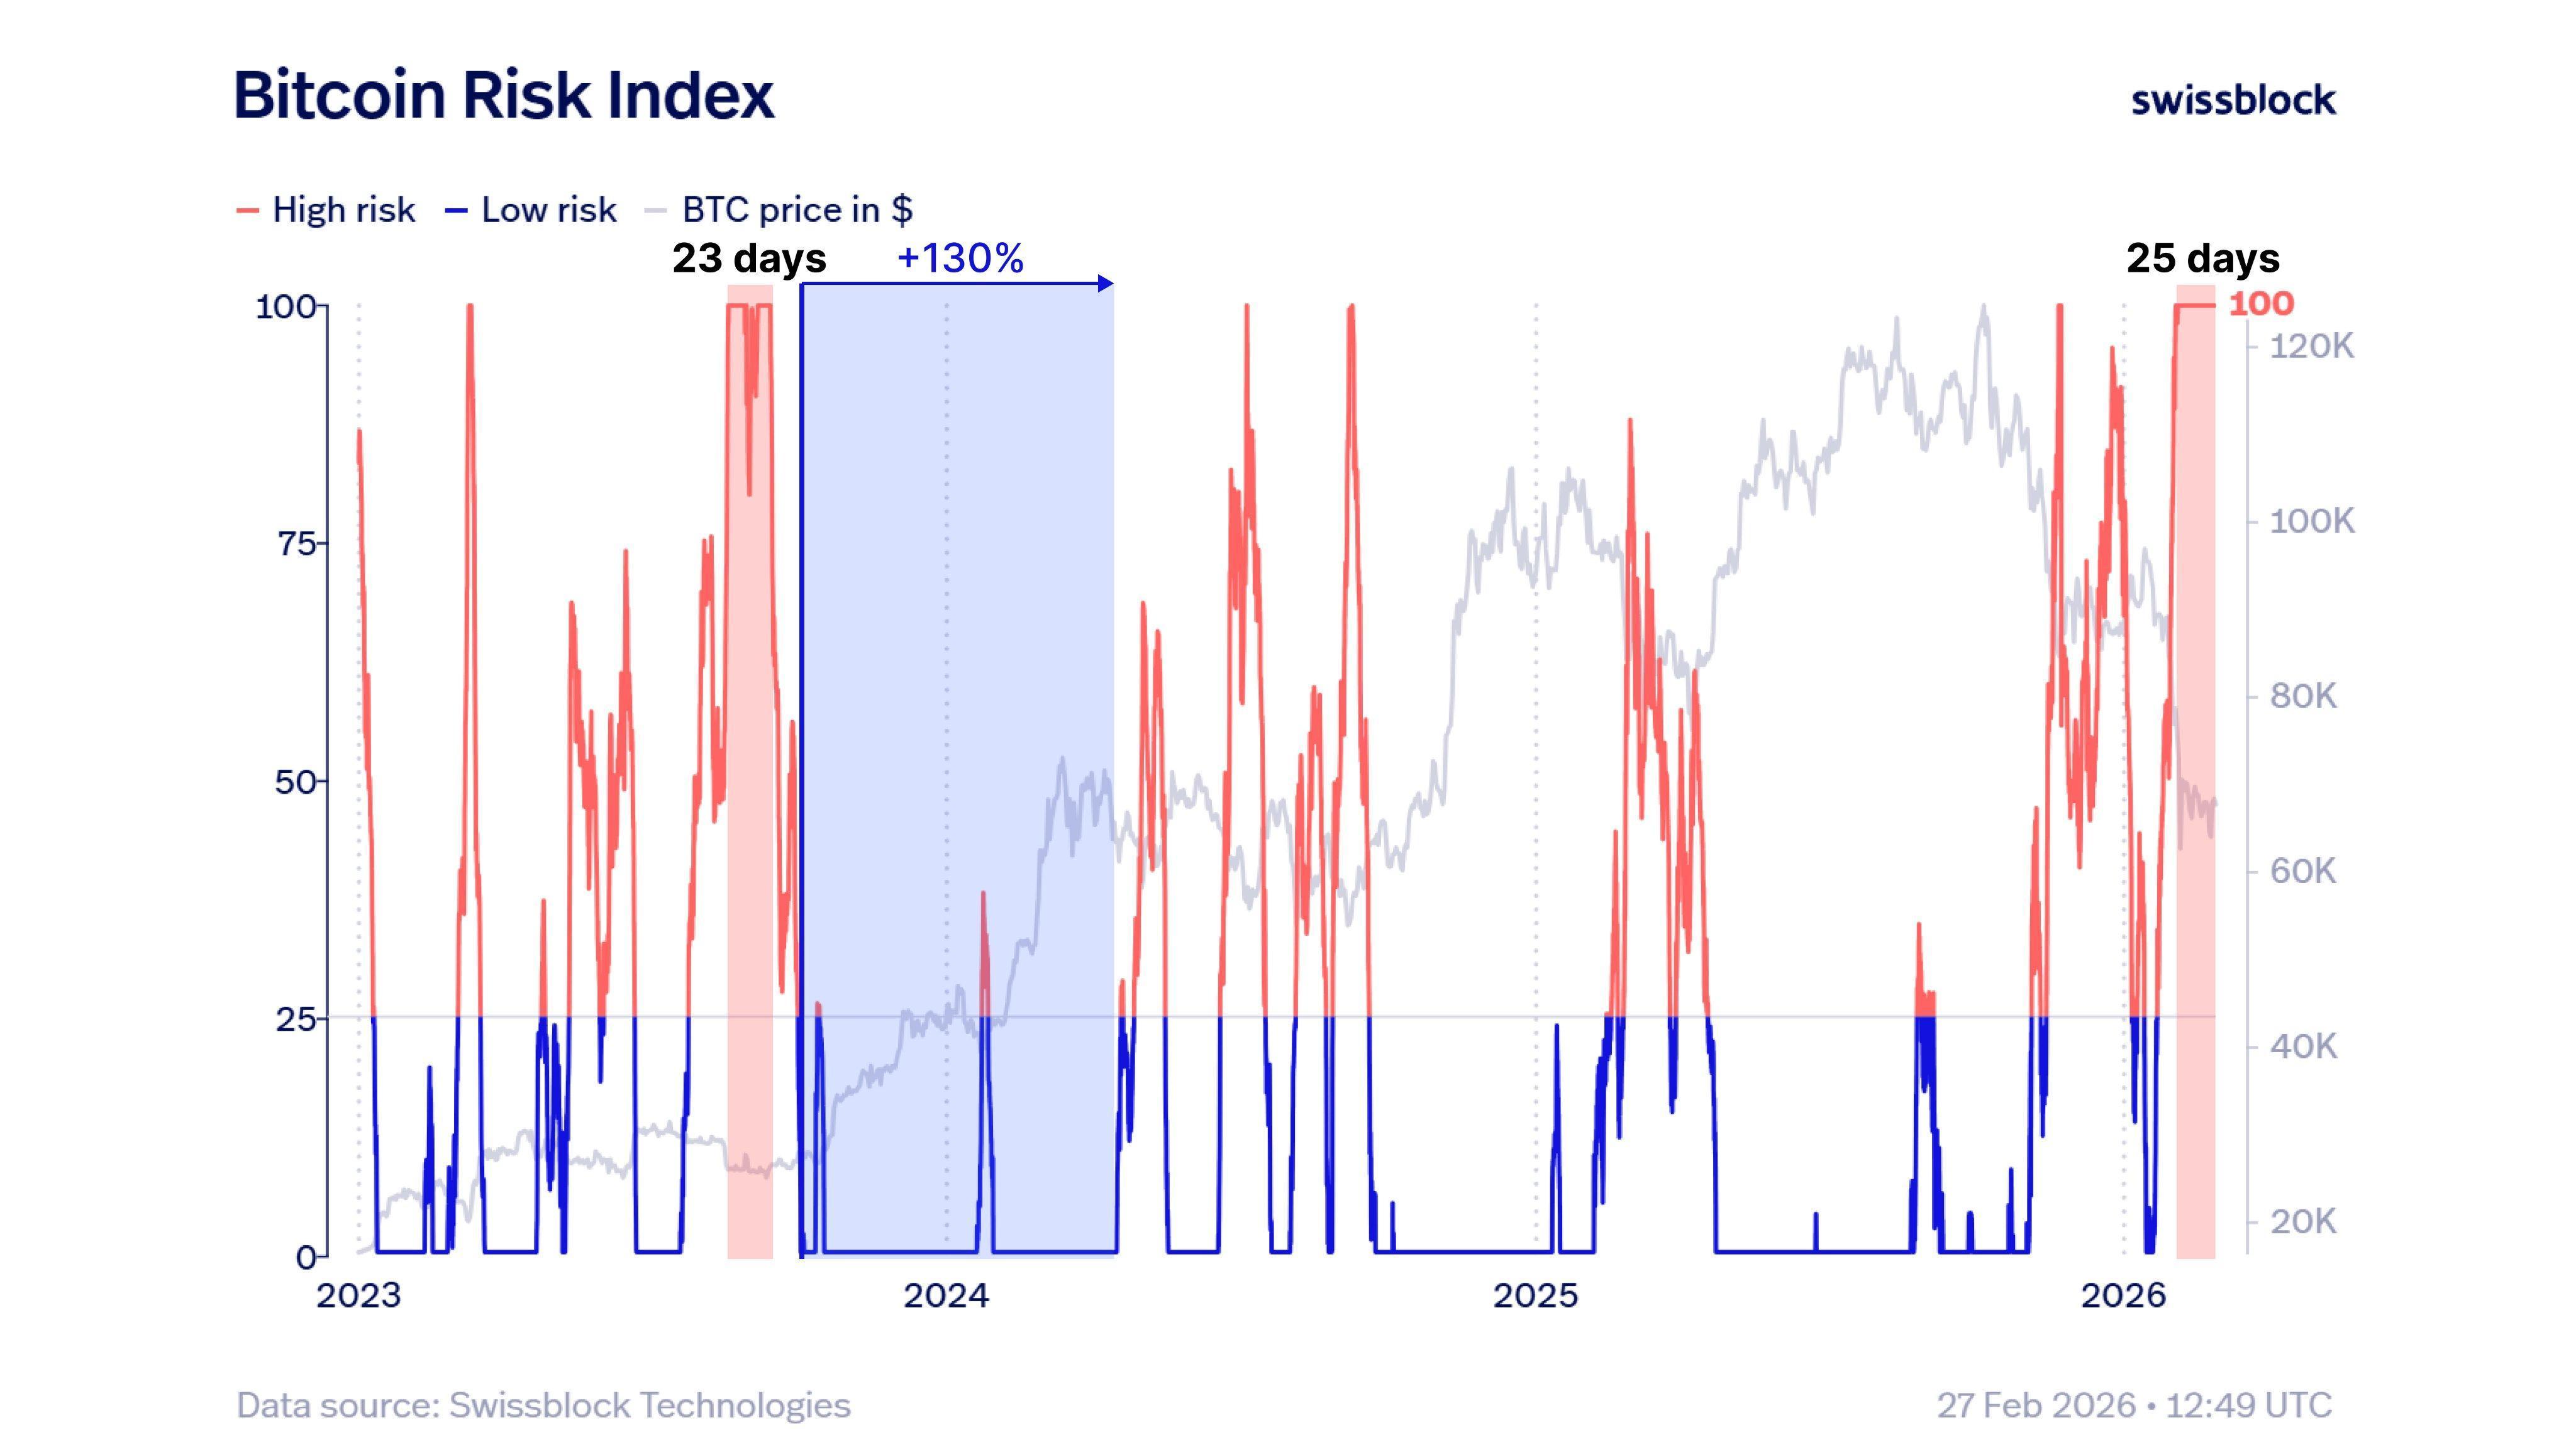 Bitcoin Risk Index. Source: Swissblock/X
MN Capital founder Michaël van de Poppe also pointed to the BTC versus supply in the profit/loss chart, which shows the price interacting with levels that previously marked bottoming phases. In 2023, the shift from high risk to low risk coincided with the start of a powerful bullish expansion.
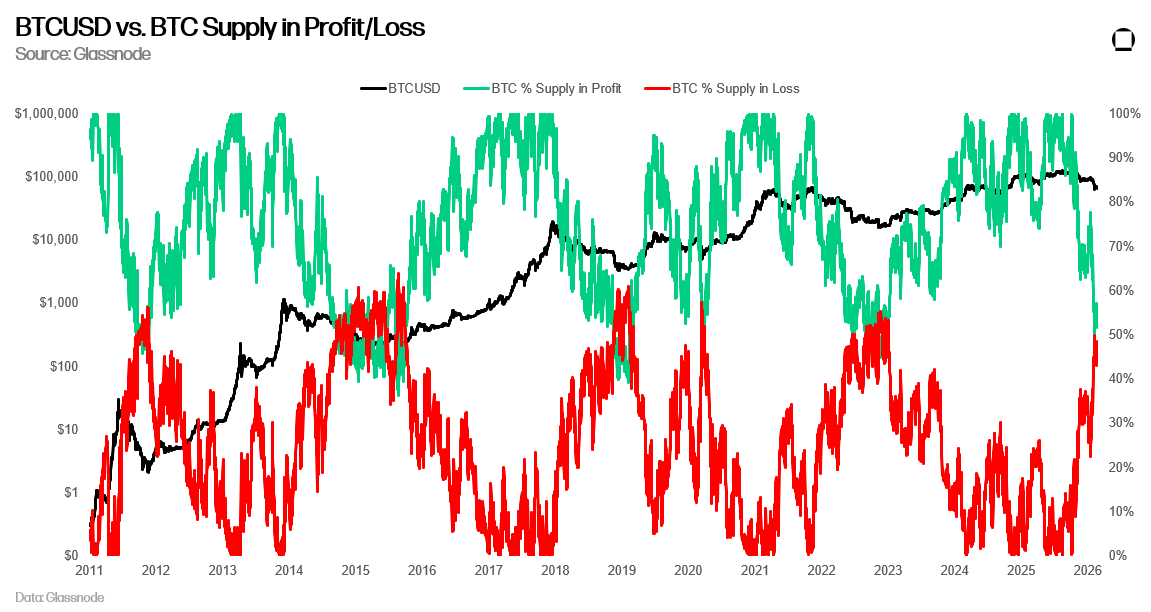 BTCUSD vs BTC supply in profit/loss. Source: Michael van de Poppe/X
Trader positioning is not in sync with an uptrend. RugaResearch noted that 30-day apparent demand continues to flip between positive and negative. While the selling pressure has faded, sustained buying demand has not maintained its dominance.
Related: Bitcoin to $30K? Analysts debate when and at what price BTC will bottom
Deeper Bitcoin drawdowns take time
Macroeconomic newsletter Ecoinometrics highlighted that a BTC decline of this magnitude rarely resolves quickly. Excluding the 2020 COVID rally, which was supported by aggressive monetary policy intervention, the recoveries from 50% drawdowns developed over an extended period.
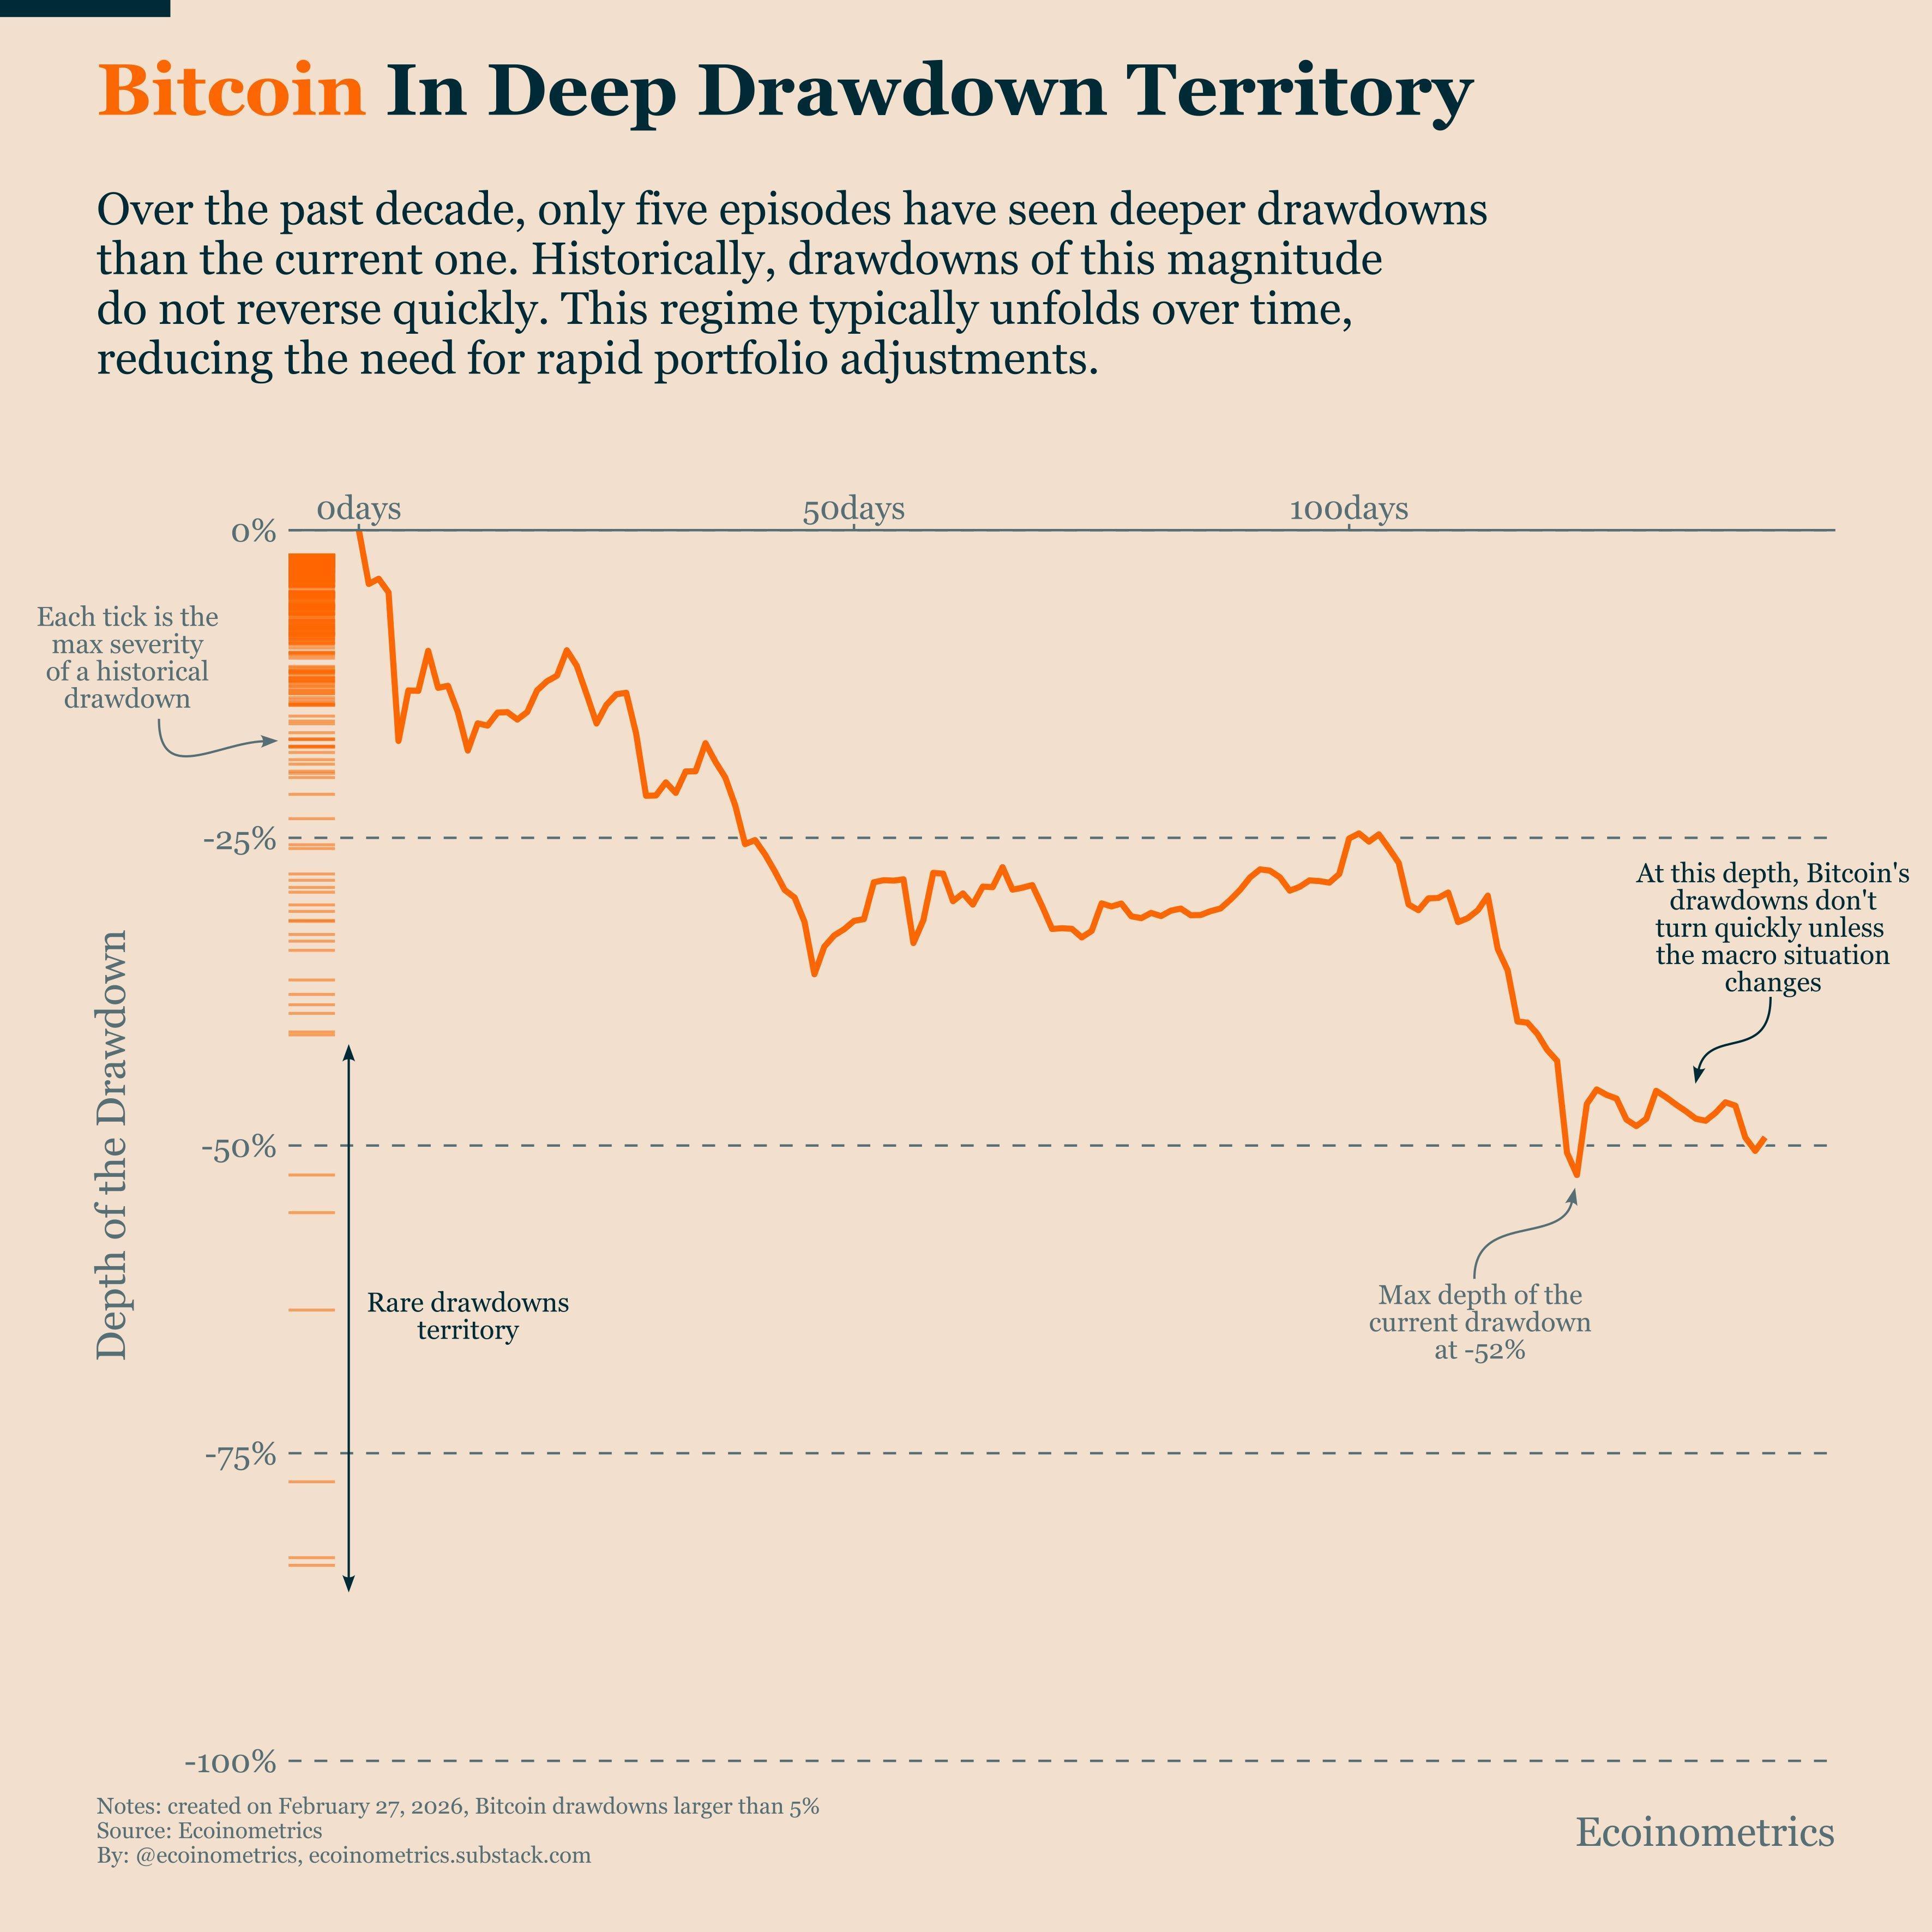 Bitcoin is in deep drawdown territory. Source: Ecoinometrics
The ETF flow data reinforces the cautious tone. Since August, cumulative inflows into gold ETFs have surpassed spot Bitcoin ETF flows on a 90-day rolling basis. Over the same period, Bitcoin funds have posted negative flows on a 90-day average rolling basis, currently sitting at –$2.06 billion.
The inflation trends added further context. Ecoinometrics noted that the headline Personal Consumption Expenditures (PCE) sits near 2.9% year-on-year, with core near 3.0% and core services above 3.4%. The Federal Reserve targets PCE, and the recent trend has not shown a clear downward shift. Without easing expectations, the liquidity expansion looks limited.
The price levels frame the debate. CMCC Crest Managing Partner Willy Woo said that any short-term relief rally to $70,000 to $80,000 is likely to be met with another round of selling pressure, since “the broader regime is heavily bearish with both spot and futures liquidity deteriorating”.
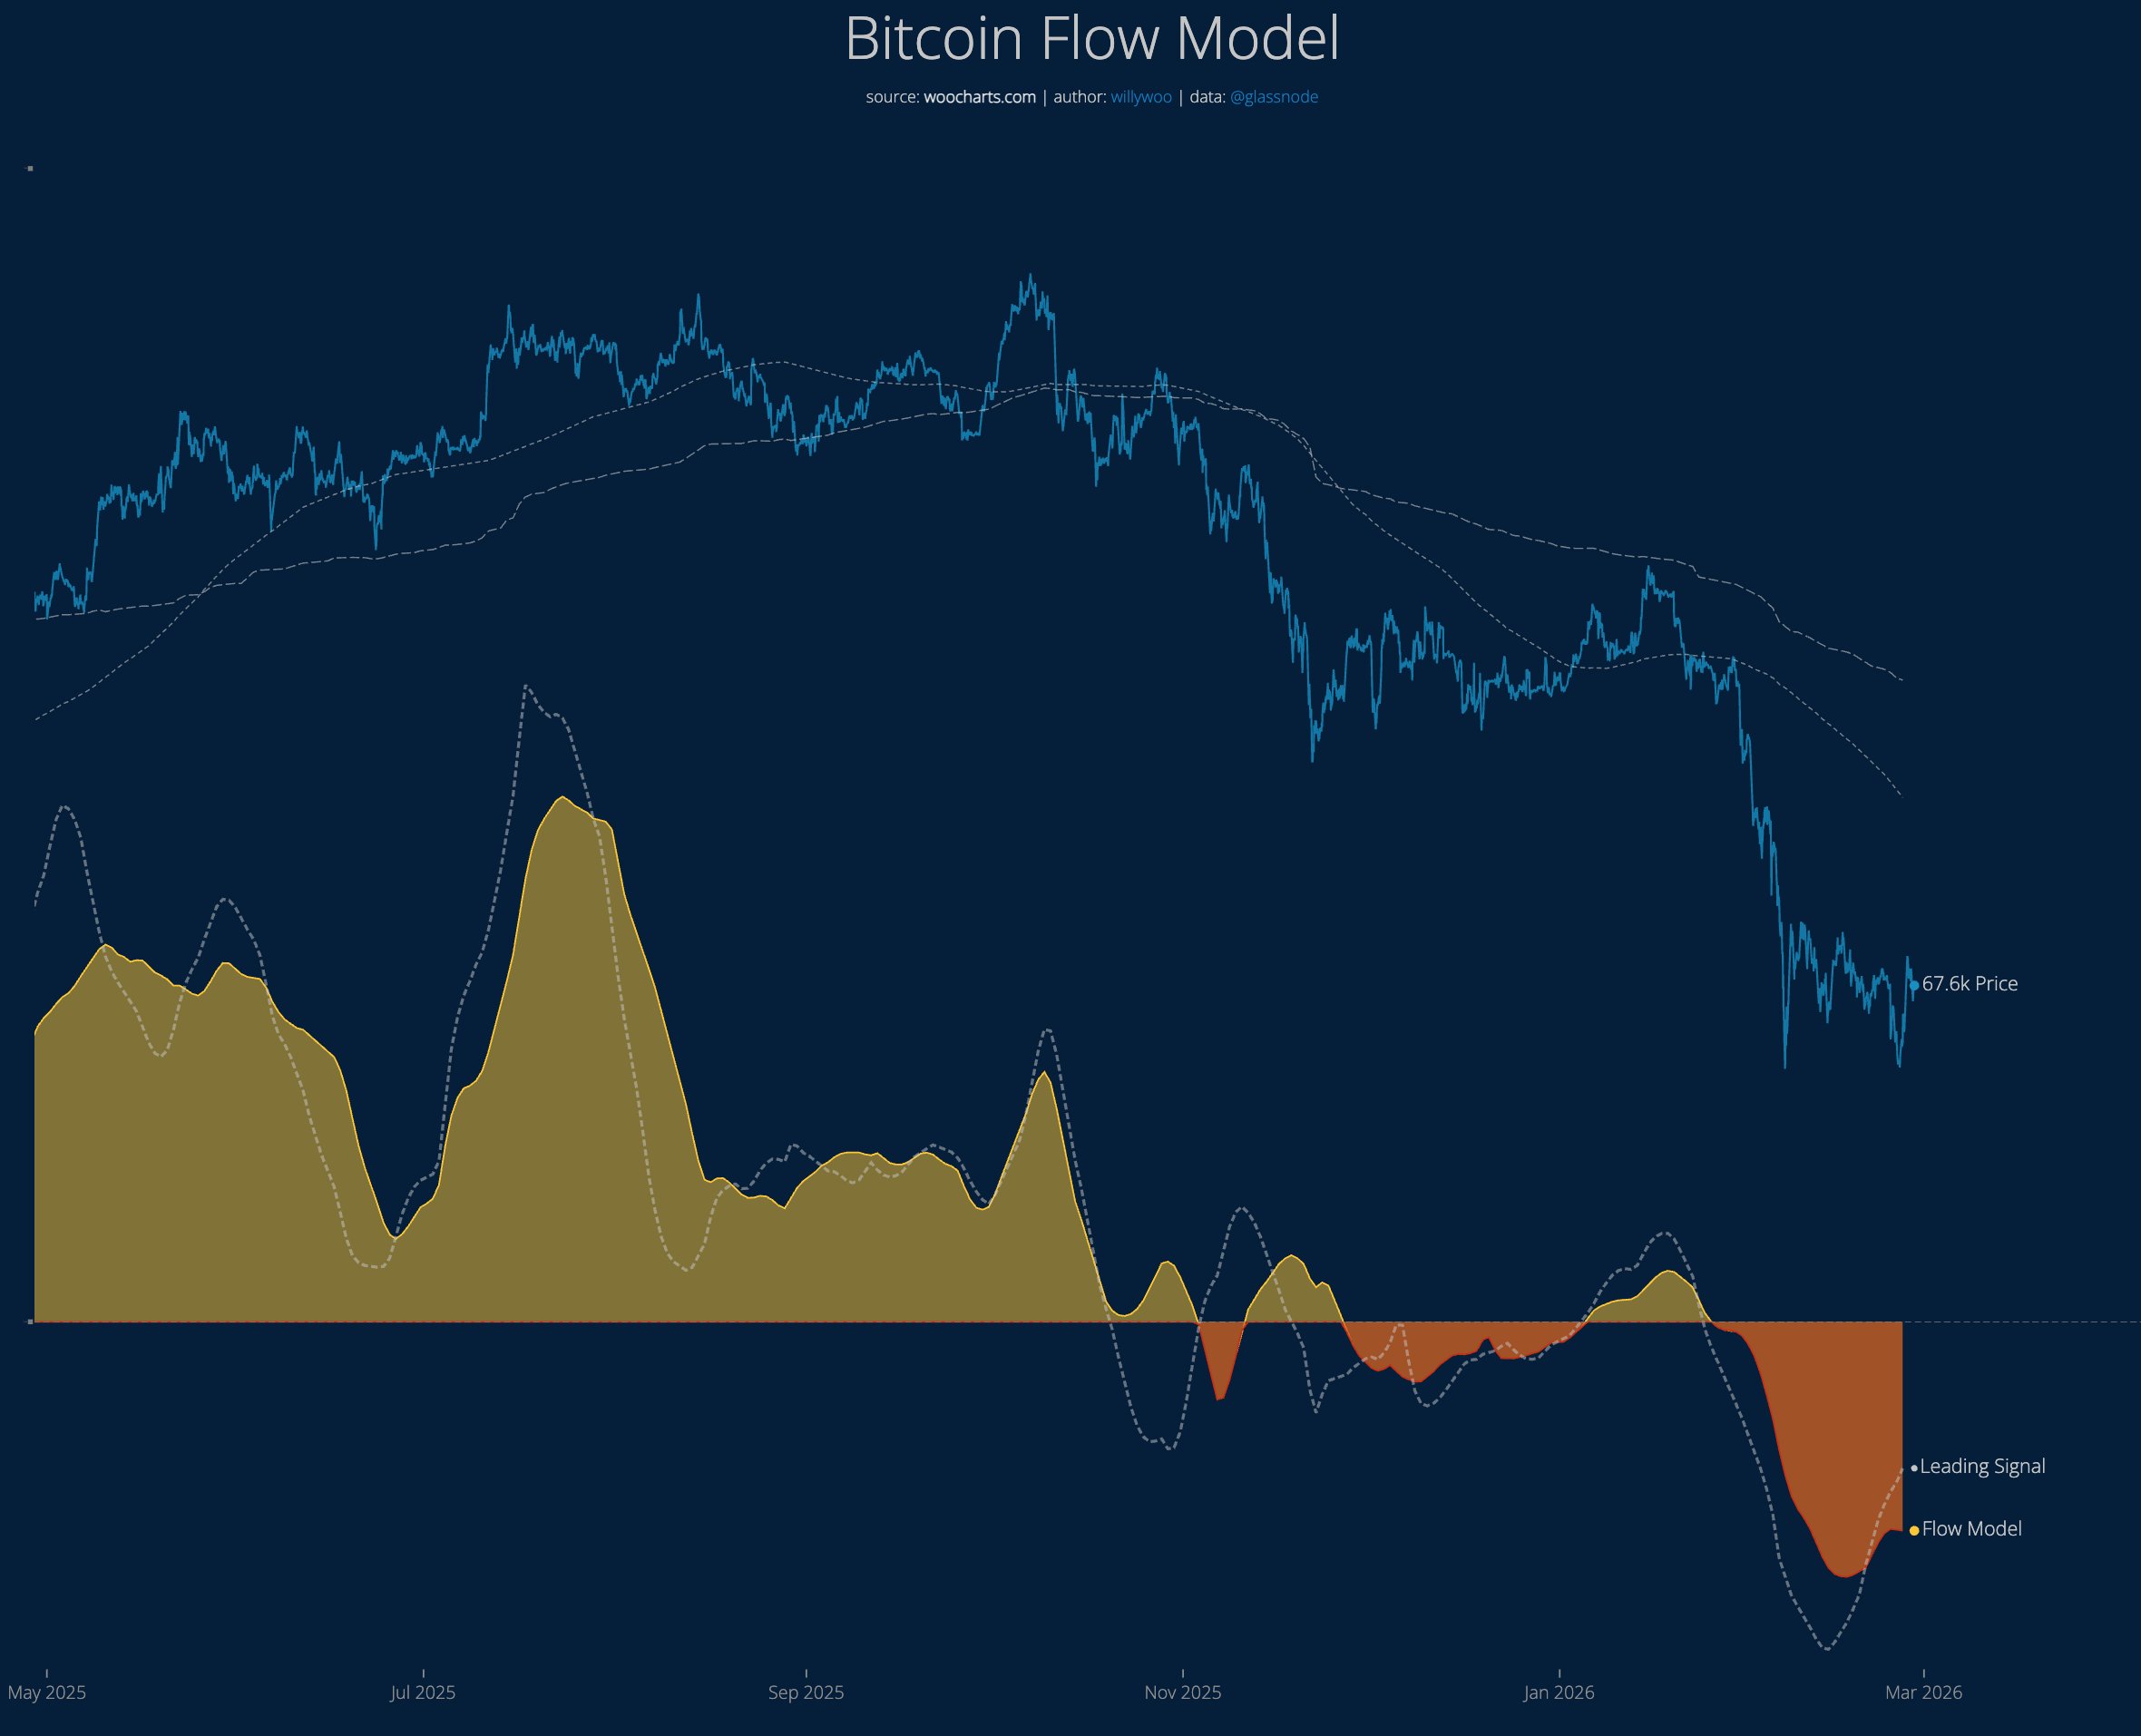 Bitcoin Flow Model. Source: Willy Woo/X
Woo said that the $45,000 level aligns with the prior bear market. Below that, $30,000 and $16,000 mark the historical support, which is tied to longer-term trend preservation.
Related: Crypto taxes updated, BTC stuck below $70K: Month in charts
Disclaimer: The content of this article solely reflects the author's opinion and does not represent the platform in any capacity. This article is not intended to serve as a reference for making investment decisions.
You may also like
Why suspend RMPs? Explanation from New York Fed SOMA Manager Perli
"Agent vs US Treasury" — Who Will Dominate the US Stock Market?
The wave of AI Agents and US Treasury yields are splitting the US stock market into two worlds: Meta's release of the Muse model boosted its market value by $220 billion in a single week, propelling the Nasdaq's standout performance; however, excluding AI stocks, the S&P 500 actually fell 1% this week, with the number of new lows on the New York Stock Exchange surpassing new highs for nine consecutive days, signaling the near end of "breadth trading." Goldman Sachs bluntly stated that this is a "frustrating cat-and-mouse game" between the stock market and interest rates—any breakout can be snuffed out by the bond market at any time, so equity holders must short US Treasury bonds to hedge simultaneously.
Hopes for a ceasefire between the US and Iran encounter obstacles again! Trump rejects Iran's seven-day proposal; inflation pressure under $100 oil prices remains difficult to ease
Trump rejects a ceasefire with Iran, and it is expected that bombings will occur again after the midterm elections. The president doubts whether Tehran will meet his demands.
Tesla ramps Optimus production 10-fold but robot hands are holding Elon back
Crypto prices
More


