
Top Gap Ups and Downs on Thursday: TM, SCCO, BKNG and More

Welcome to the Daily Gap column!
In the realm of technical analysis, gaps are often viewed as critical indicators of potential price movements. Particularly those that emerge at market open, these gaps can signify dramatic shifts in market sentiment.
. The directionality of these gaps provides traders with insights into short-term trends, allowing them to develop corresponding trading strategies.Here is the showcase of the top 10 stocks with the largest gap sizes as of yesterday's close. The "Gap %chg" metric indicates the magnitude of these gaps, with all included stocks reaching a market capitalization of $5 billion.

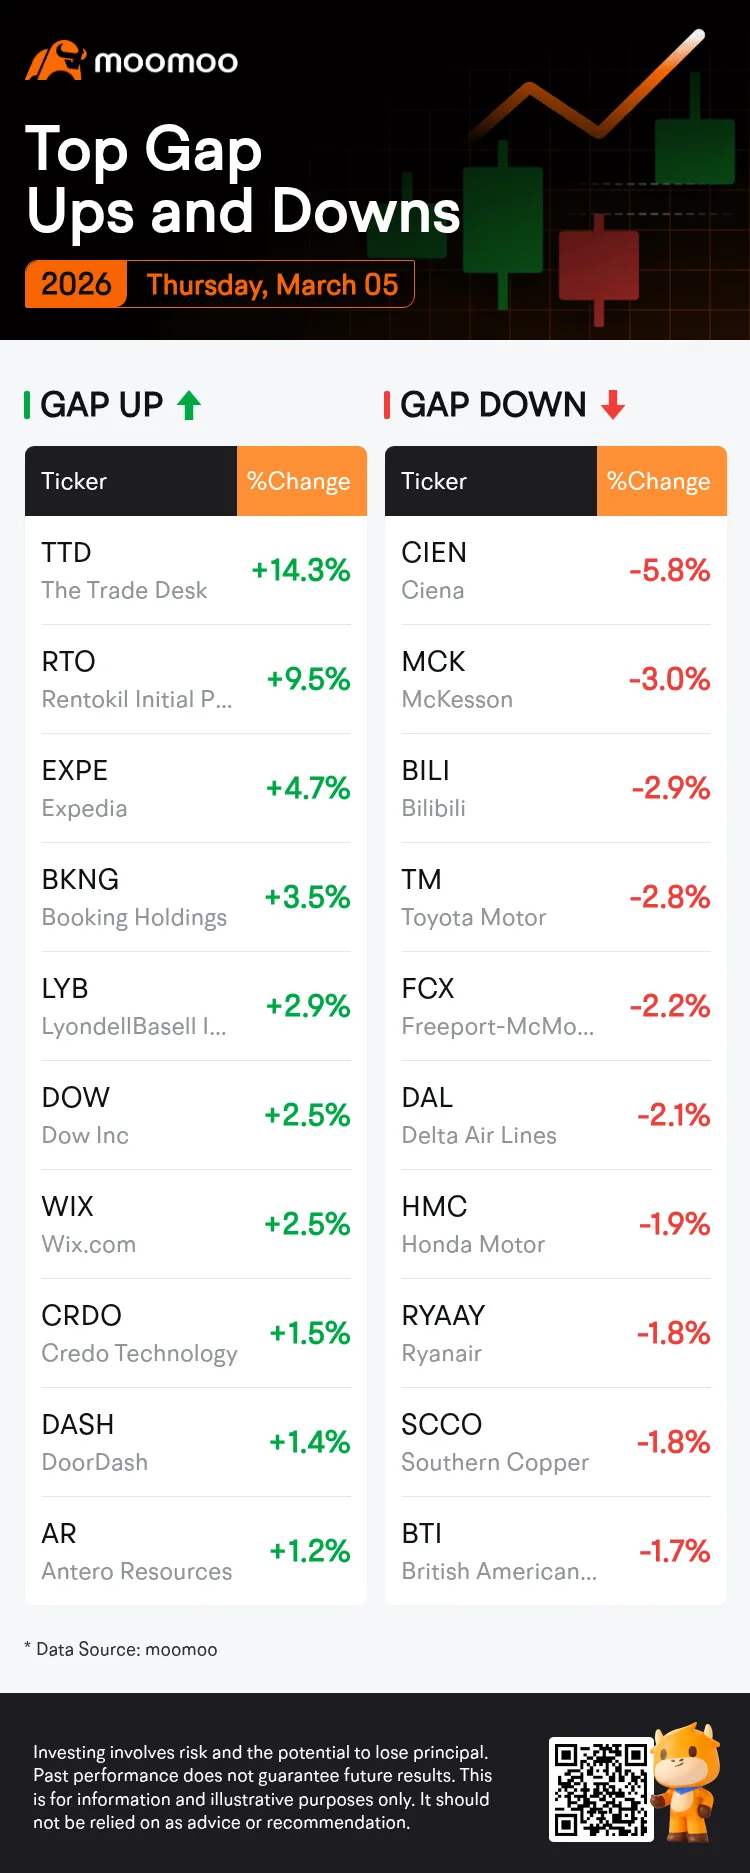
Additionally, we highlight stocks that have exhibited the longest streak of consecutive gaps in either up or down direction over the past 250 trading days. These stocks are also filtered with the same market capitalization criterion.
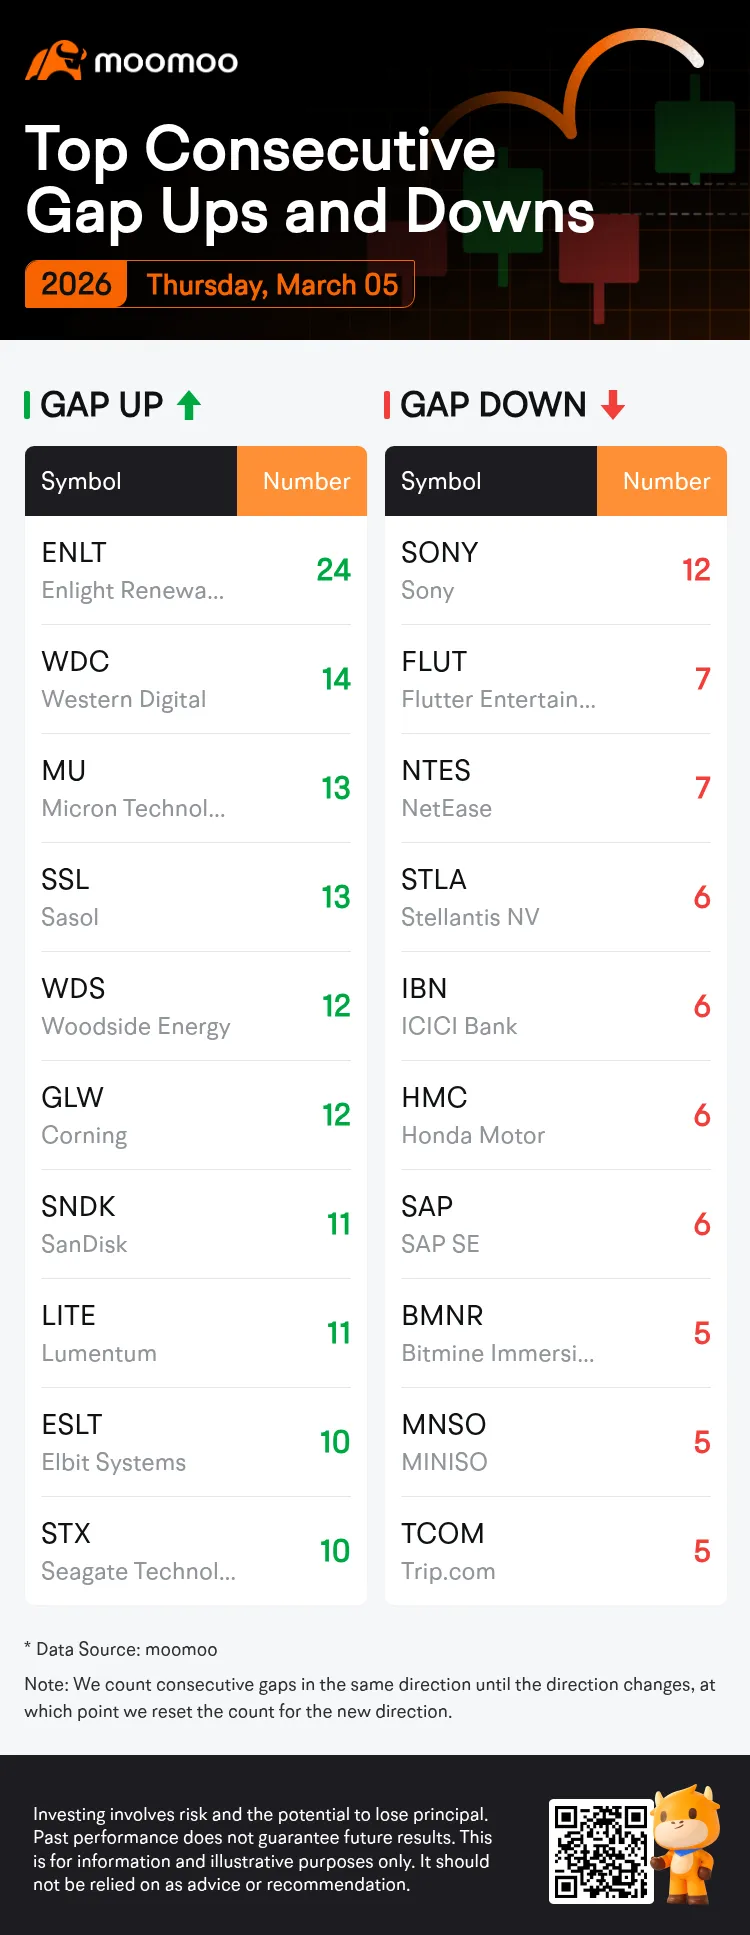
Technical traders believe that gaps can provide directional clues, but the accuracy of a single indicator is not sufficient to predict stock movements. Investors still need to incorporate various factors, including board market sentiment, company fundamental factors, technical indicators, and so on.
Options strategies can be an effective way to capitalize on anticipated price movements in different trending scenarios.
For investors optimistic about a stock's upward trajectory, some commonly utilized options strategies include the Long Call, the Bull Call Spread, and the Cash-Secured Put, each with different risk levels.
The Long Call involves purchasing a call option, limiting risk to the premium paid while offering potentially unlimited profit if the stock rises. The Bull Call Spread is a more conservative approach, where investors buy a call at a lower strike and sell another at a higher strike, reducing costs and capping both gains and losses. Alternatively, the Cash-Secured Put involves selling a put option while holding enough cash to buy the stock at the strike price if assigned, allowing investors to potentially acquire the stock at a discount while generating premium income.
For investors anticipating a downward trend in a stock, several options strategies can be employed, each with varying risk levels.
The Long Put strategy involves purchasing a put option, granting the right to sell the stock at a specified strike price before expiration. This strategy offers significant profit potential if the stock price declines, with risk limited to the premium paid for the option. The Bull Put Spread combines selling a put option at a higher strike price while simultaneously buying another put option at a lower strike price, allowing traders to collect premium income while capping potential losses, thus providing a more balanced risk-reward profile. Another strategy is the Covered Call, where an investor sells a call option, committing to sell the stock at the strike price if exercised. This generates income if the stock stays flat or falls but caps upside potential if the stock surges, making it best for experienced traders.
What are gaps?
Price charts sometimes have blank spaces known as gaps (up gaps and down gaps), where the price of a stock moves sharply up or down, with little or no shares traded in between. This is why the asset's chart shows a gap in the normal price pattern. Normally this occurs between the close of the market on one day and the next day's open.
For an up gap, the low price of the day must be higher than the high price of the previous day. A down gap is just the opposite of an up gap.
Gaps can show signals that something important has happened to the fundamental or the psychology of traders that accompanies this market movement.
For example, if an unexpectedly high earnings report comes out after the market has closed for the day, a lot of buying interest could be generated overnight, leading to an imbalance between supply and demand. When the market opens the next morning, the stock price will likely rise in response to the increased demand from buyers. If the stock price remains above the previous day's high throughout the day, then an up gap is formed.
Disclaimer: The content of this article solely reflects the author's opinion and does not represent the platform in any capacity. This article is not intended to serve as a reference for making investment decisions.
You may also like
Dow Jones Industrial Average bounces on Iran's latest Hormuz offer
U.S. stocks opened higher and fluctuated, the Japanese yen rebounded more than 1% intraday, 10-year U.S. Treasury yields broke above 5.22% again, and U.S. crude oil once fell nearly 3%.
After the release of U.S. consumer confidence data, the S&P and Nasdaq turned negative, while the Dow is poised to break a three-day losing streak but is set for a fourth consecutive weekly decline. Meta pulled back, falling more than 3% during the session. The U.S. 10-year Treasury yield surpassed 5.22% again, marking a new high for the third day in a row since 2007, while the 30-year yield reached its highest level since 2004. The yen/dollar pair surged 1.2% intraday, as Japanese and U.S. officials successively signaled concerns over the weak yen. Expectations for a diplomatic resolution between the U.S. and Iran are rising, halting crude oil's two-day climb.
US Treasury volatility surges, triggering alarms! BofA’s Hartnett warns of rising deleveraging risks as higher yields become main threat to the market
Bank of America strategist Michael Hartnett warns that the recent sharp rise in volatility in the US bond market is increasing the risk of broader deleveraging in financial markets.
U.S. diesel prices surge 83% this year! Apollo Chief Economist warns: Cost pass-through may make core inflation more stubborn, Federal Reserve can't ignore it
Torsten Slok, Chief Economist at Apollo Global Management, has warned that the inflation threat posed by the surge in U.S. diesel prices to historic highs may be more serious than the Federal Reserve currently realizes.
Crypto prices
More


