
Gold Price Outlook for March 12 – Important Intraday Entry Points for Active Traders

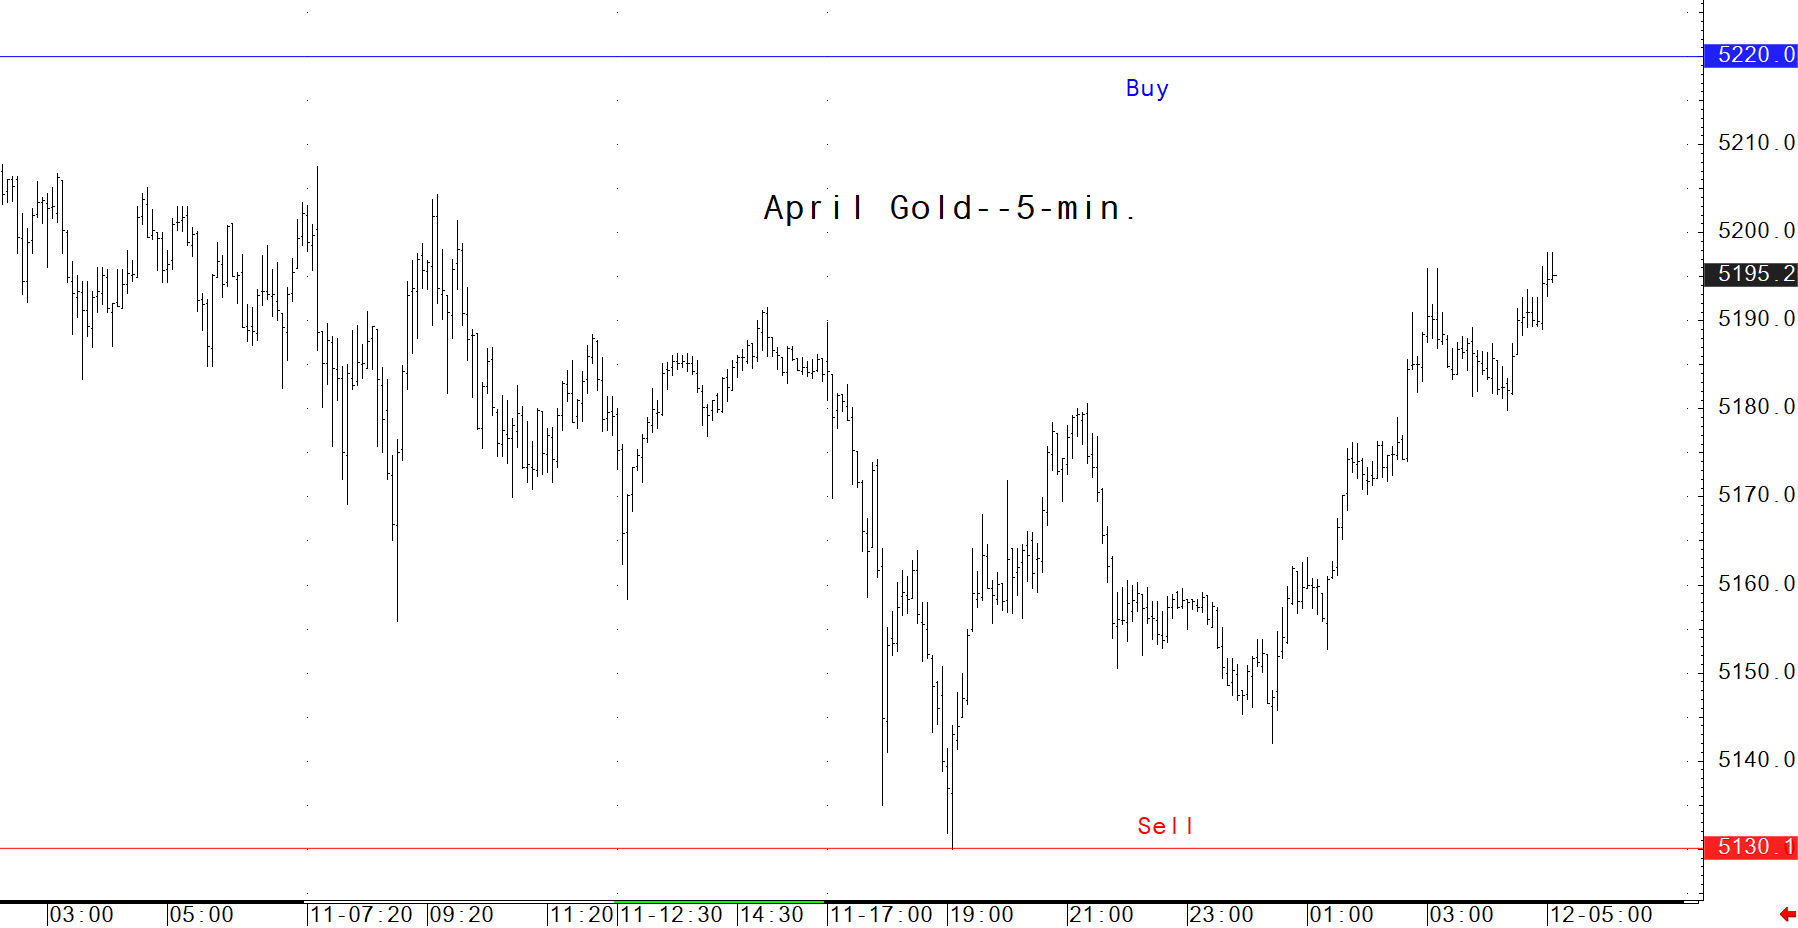
Comex Gold Futures: 5-Minute Chart Insights
For those who actively trade or monitor gold futures throughout the day, this 5-minute bar chart offers a powerful resource for analysis and decision-making. By highlighting crucial short-term support and resistance zones, it helps identify optimal points for entering buy or sell positions. (Keep in mind: seasoned traders often buy when prices begin to rise and sell when prices start to decline.) If you’re engaged in intra-day gold trading, this exclusive daily chart—available only at Kitco—is an essential tool you won’t want to miss.
Disclaimer: The content of this article solely reflects the author's opinion and does not represent the platform in any capacity. This article is not intended to serve as a reference for making investment decisions.
You may also like
NASDAQ TRADE HALT CONTINUES <UCFI.O> REASON NOT AVAILABLE AT 03:58 AM
NASDAQ TRADE HALT CONTINUES <OST.O> REASON NOT AVAILABLE AT 03:58 AM
Oil Price Today (September 25): Crude oil slips to $105 as truce hopes clash with Middle East attacks. What’s next?
Hedge fund with 235% return says gold price decline is temporary
Crypto prices
More


