
Bitcoin’s ‘powerful move’ nears as Bollinger Bands warn of volatility

Bitcoin (BTC) could see further upside volatility as several technical and onchain indicators suggested the BTC price was due for a “powerful“ upward breakout.
Key takeaways:
Bitcoin’s Bollinger Bands indicator hints at major volatility ahead.
BTC’s symmetrical triangle breakout targets $84,500.
Heavy BTC accumulation by investors around $83,900-$85,200 could stop bulls.
Bitcoin Bollinger Bands point at “strong” breakout
Bollinger Bands, a technical indicator used by traders to assess price momentum and volatility within a certain range, have reached their tightest point ever on the monthly time frame, signaling that volatility should be expected soon.
The “tightest Bollinger Band squeeze on the monthly Bitcoin chart, ever,” said analyst Cantonese Cat in an X post on Tuesday, adding:
“This will lead to a very powerful move when it expands.”
The BTC/USD pair surged about 235% between December 2023 and August 2025 to its current all-time high of $126,000, after breaking above the upper boundary of the Bollinger Bands. A similar occurrence in 2016 triggered the 2017 bull run, with BTC price rallying more than 4,000%.
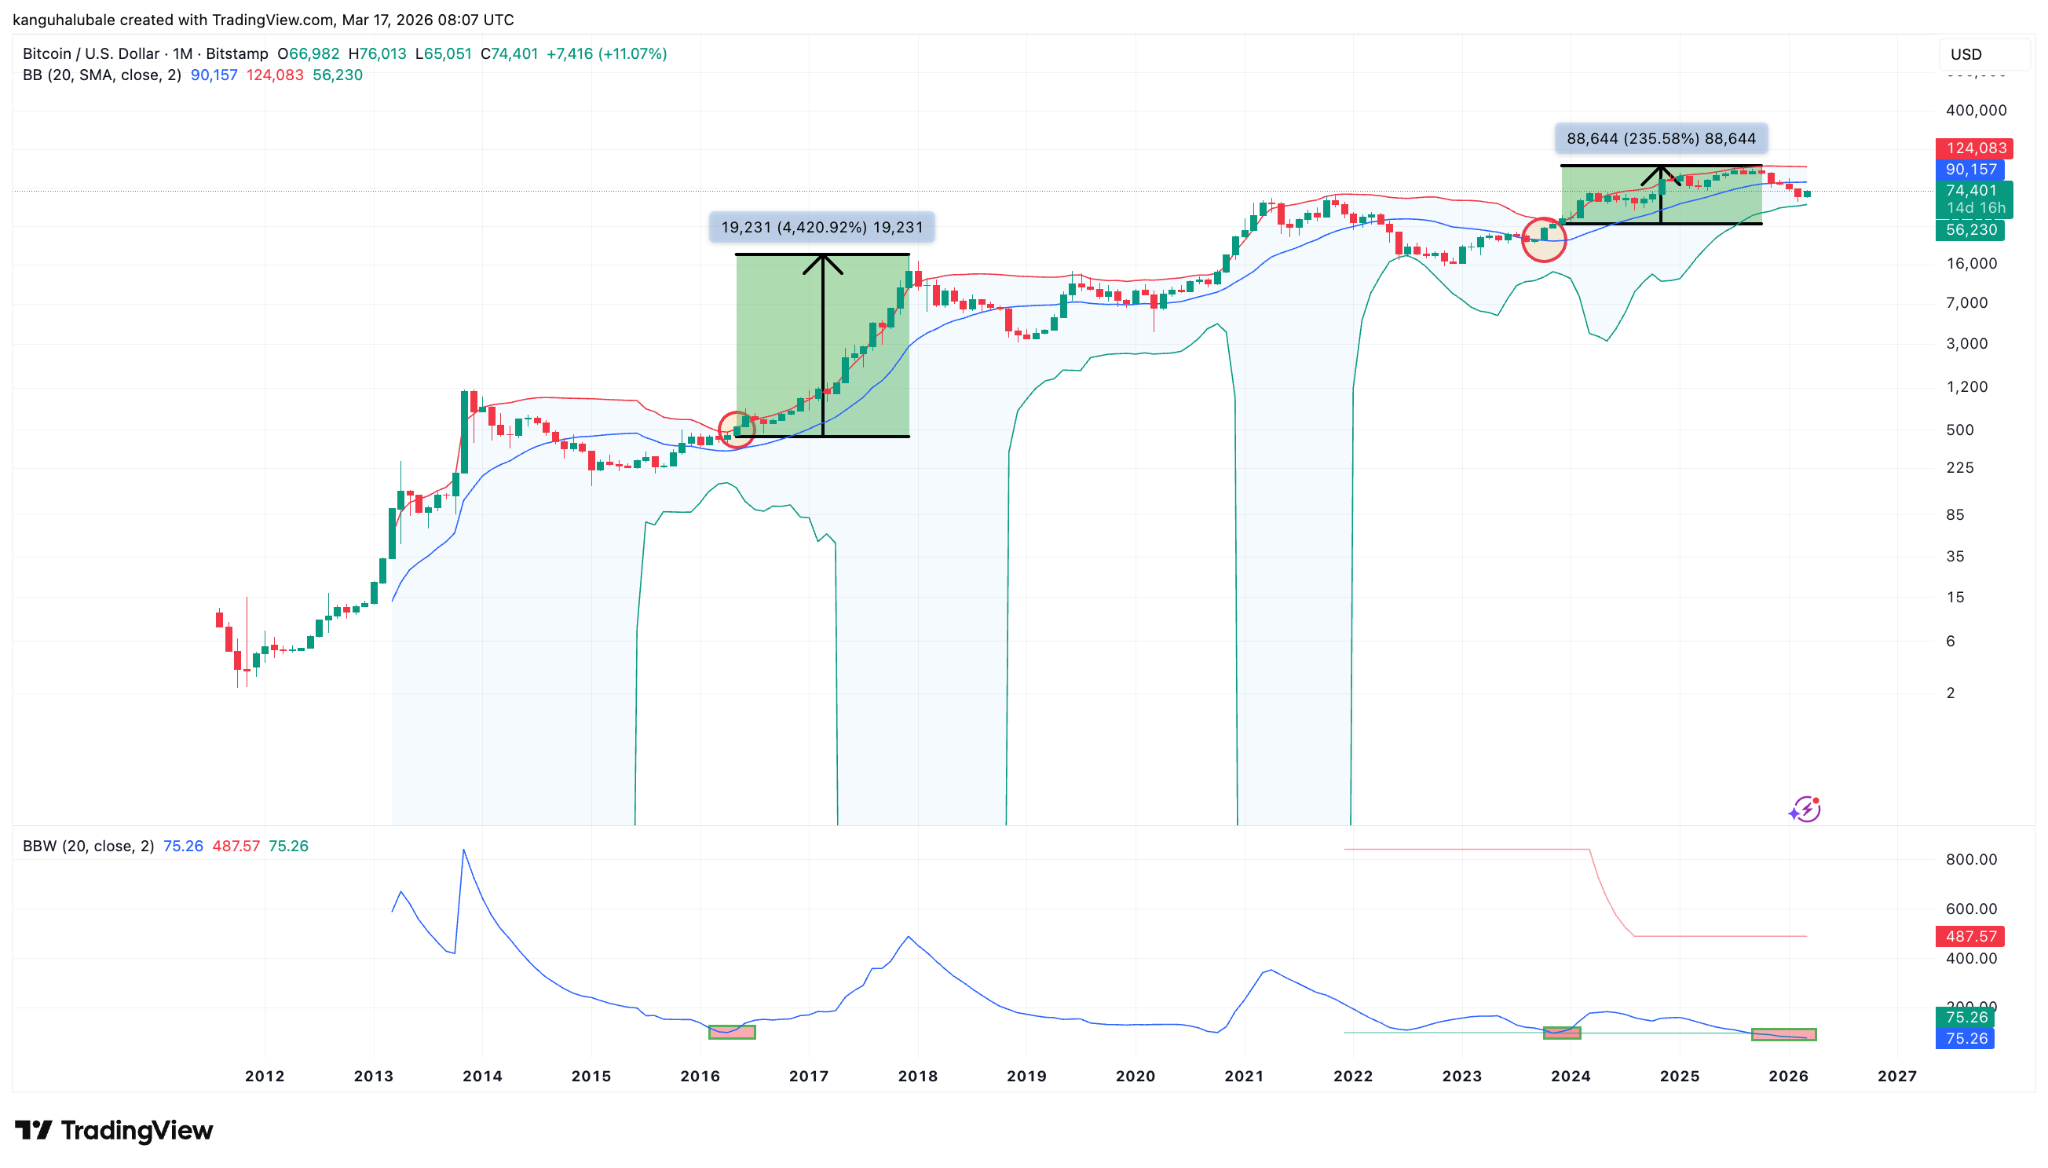 BTC/USD monthly chart. Source: Cointelegraph/
TradingView
BTC/USD monthly chart. Source: Cointelegraph/
TradingView
Another analyst, Osemka, said such “squeezes produce strong moves.”
Meanwhile, Bitcoin has reclaimed key support lines, namely the 200-week exponential moving average (EMA) at $68,000, and the 50-day simple moving average (SMA) at $70,900 on its latest run to six-week highs above $74,400.
That simultaneously pushed the price above the upper trendline of a symmetrical triangle at $68,500.
A symmetrical triangle forms when price makes lower highs and higher lows, compressing into a tightening range. It resolves when the price breaks either of the trendlines and moves by as much as the pattern’s maximum height.
This places the bullish target of the prevailing chart pattern at $84,500, 14% above the current price.
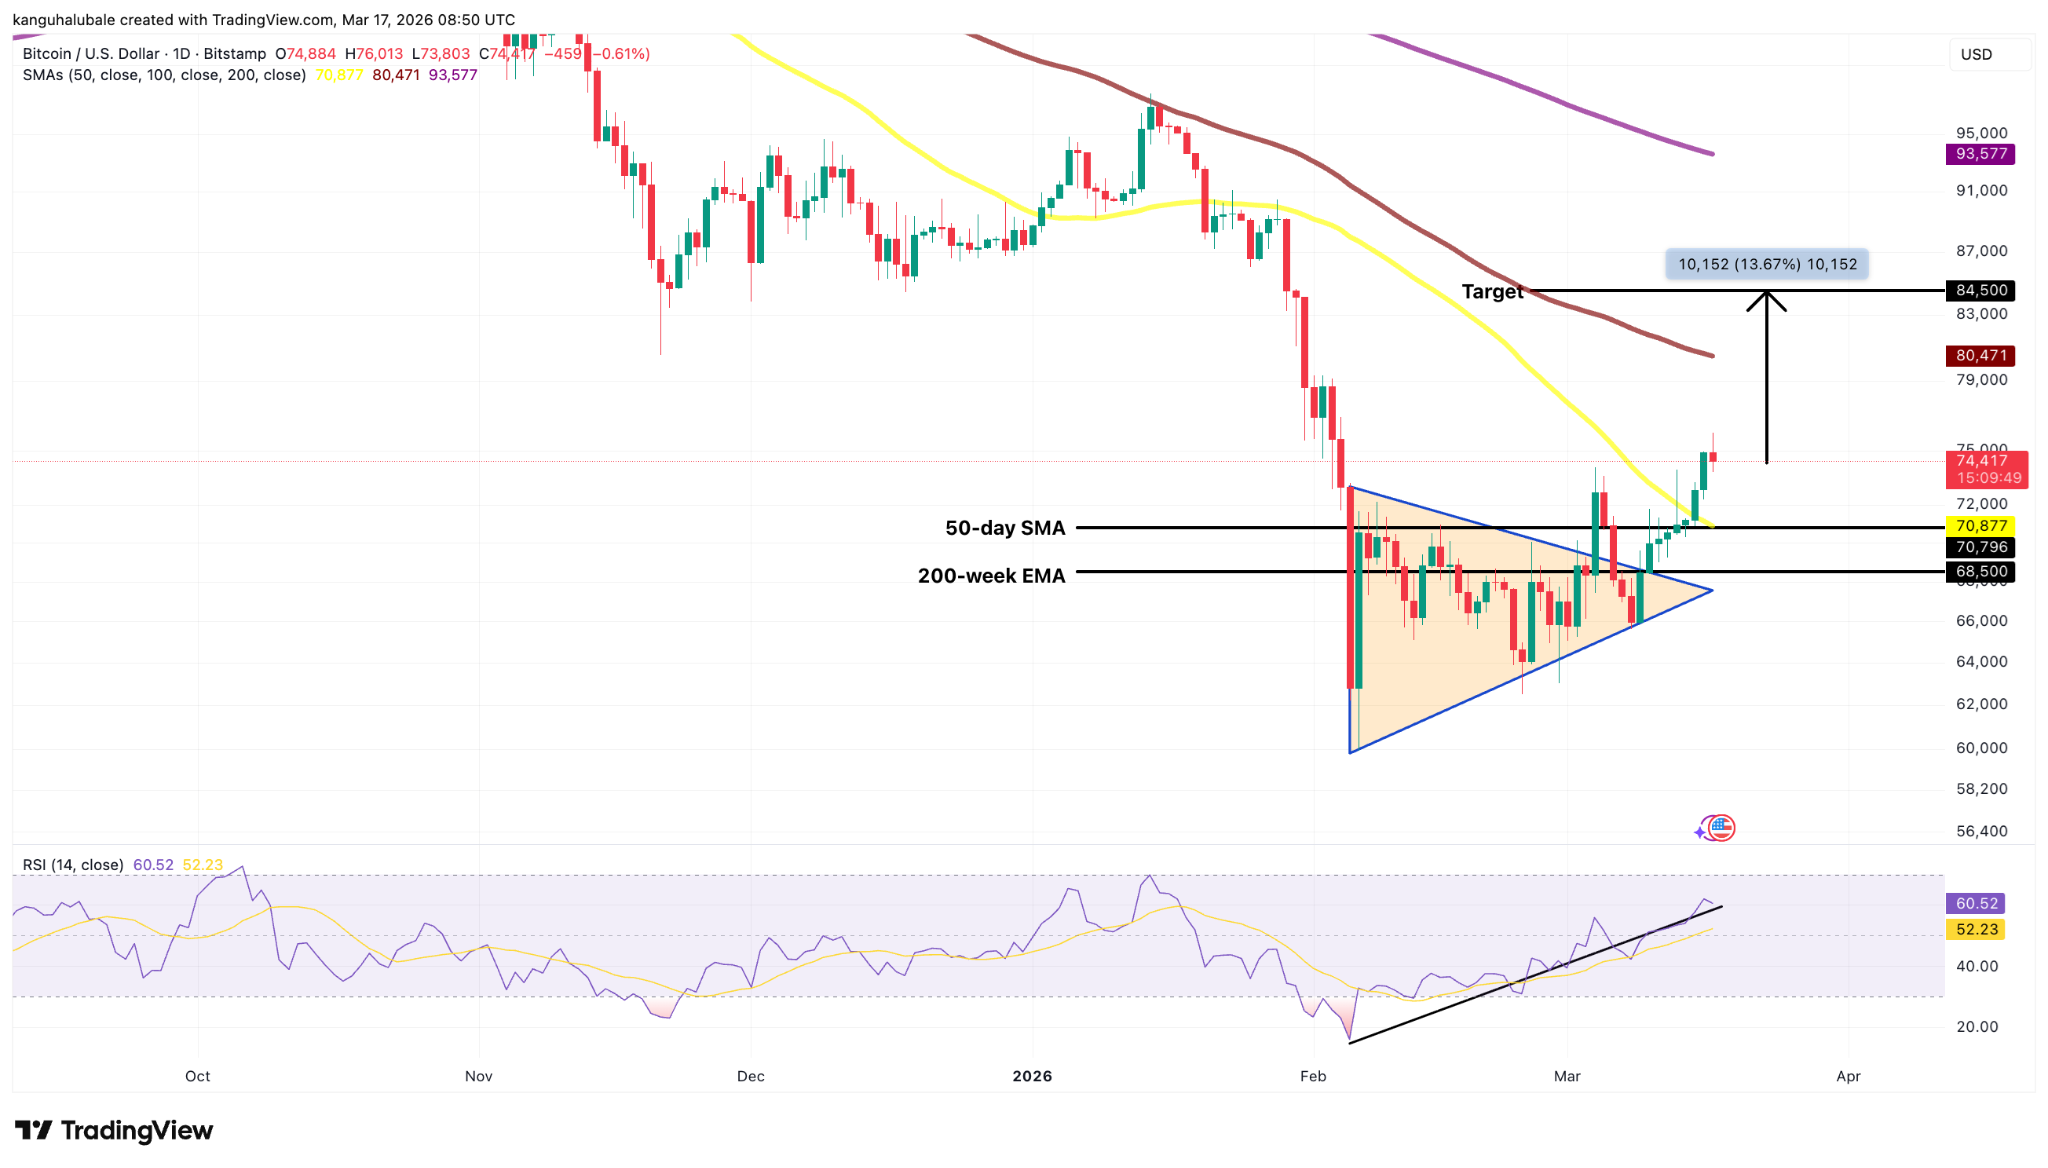 BTC/USD daily chart. Source: Cointelegraph/
TradingView
BTC/USD daily chart. Source: Cointelegraph/
TradingView
The relative strength index, or RSI, is in the positive territory at 60, indicating that the buyers are taking charge. Bitcoin’s next hurdle is the 100-day SMA near $80,500.
As Cointelegraph reported, a close above this level would strengthen the breakout, suggesting that the downtrend may be over.
Onchain data caps Bitcoin’s upside at $84,000
Glassnode’s cost basis distribution heatmap shows a heavy accumulation at $83,000-$85,000, where investors acquired more than 898,000 BTC.
The cost-basis clusters identify the price zones where big investors established positions, often acting as magnets during upward moves as investors defend entry levels or add exposure.
This means “4.4% of the BTC supply was scooped up at those levels between November of last year and early February this year,” analyst and founder at The DeFi Report Michael Nadeau said in an X post on Tuesday.
This area represents a key source of sell pressure, likely to cap recovery attempts around the $84,000 level.
“That level also corresponds to the Short Term Holder cost basis,” Nadeau said, adding:
“It's likely that the current countertrend rally will hit resistance at those levels.”
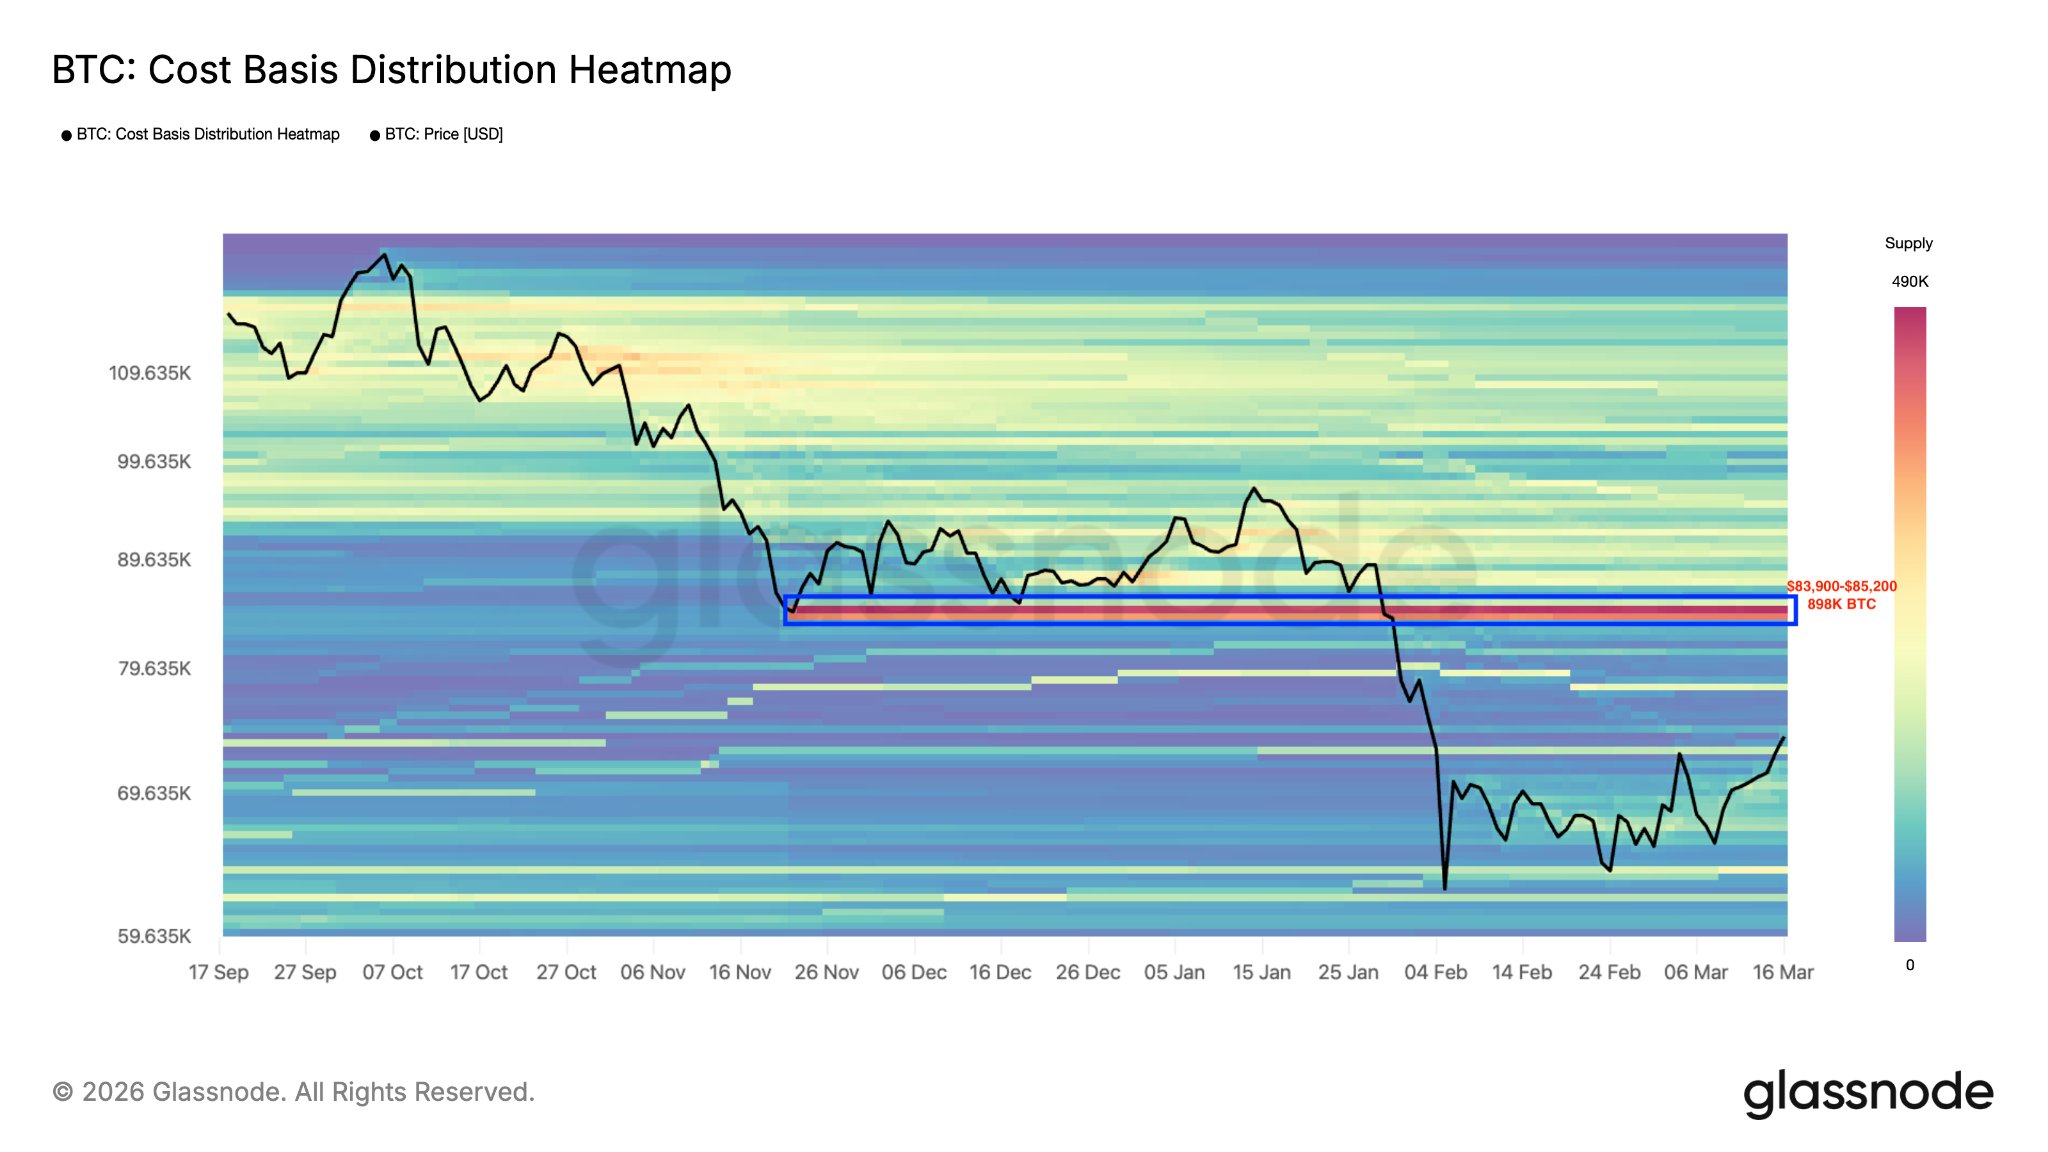 Bitcoin: Cost basis distribution heatmap. Source: Glassnode
Notably, there is a relatively limited historical supply concentration between $74,200 and the $83,000 cost-basis cluster, meaning a break above the current range may allow the price to move more freely toward the bigger overhead resistance.
Order-book liquidity data also points to $82,000, where a “massive cluster of shorts” sits, according to analyst Zord.
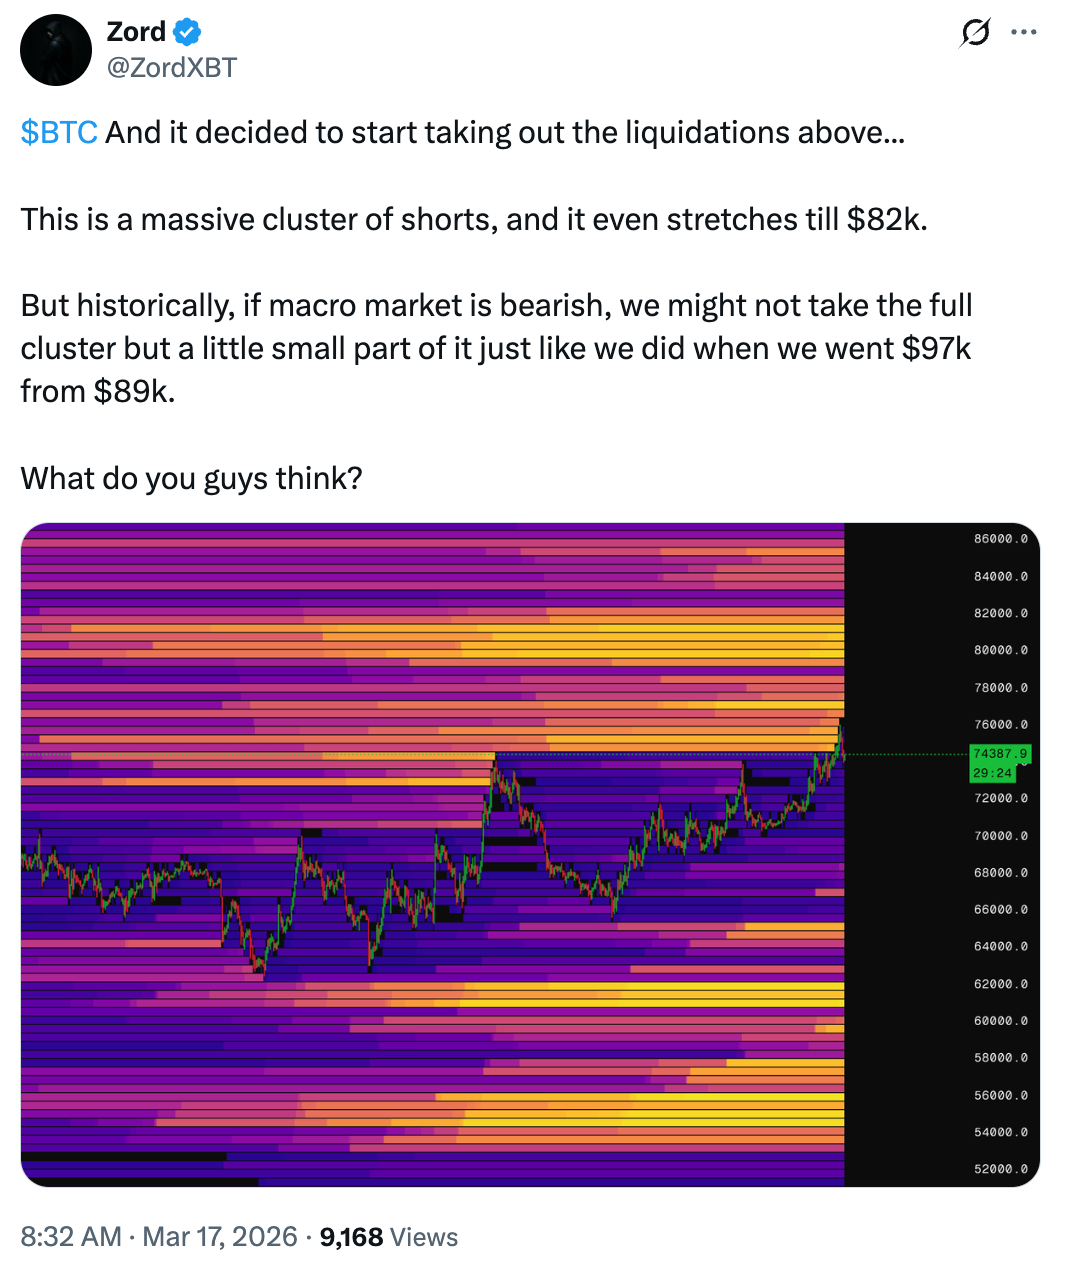 Bitcoin liquidation heatmap. Source: X/Zord
As Cointelegraph reported, some analysts believe that the long-term BTC price downtrend is still in play, arguing that the latest relief bounce was part of standard BTC price bear market behavior.
Disclaimer: The content of this article solely reflects the author's opinion and does not represent the platform in any capacity. This article is not intended to serve as a reference for making investment decisions.
You may also like
Indian Rupee starts the week negatively amid higher oil prices
AI demand drives TSMC to accelerate capacity expansion, 2nm monthly production aims for 120,000 wafers by year-end
According to reports, industry giants such as Apple, Nvidia, and AMD have collectively increased their orders by 10% to 20%, directly boosting TSMC's 2nm monthly production capacity to 120,000 wafers by the end of the year, which exceeds the previous estimate by more than 20% and brings forward the 2027 target by two years. For the first time in history, five factories will ramp up production simultaneously, and the annual compound growth rate of capacity from 2026 to 2028 will reach as high as 70%.
Long-term US Treasury Sell-off Continues! 10-Year Treasury Yield Breaks 5.2% Again, “AI Boom vs. Rising Financing Costs” Narrative Showdown Intensifies
On Monday, oil prices rose and US Treasury bonds were sold off again as former US President Donald Trump rejected Iran's latest proposal to reopen the Strait of Hormuz, heightening concerns about inflation.
Banks Have Been Earning Effortlessly from Idle Funds for Years—Will AI Agents Change Everything?
For years, banks have profited from customers' idle funds, but AI agents may be about to change this situation.
Crypto prices
More


