
Gold market outlook for March 18 – important intraday price points for active traders

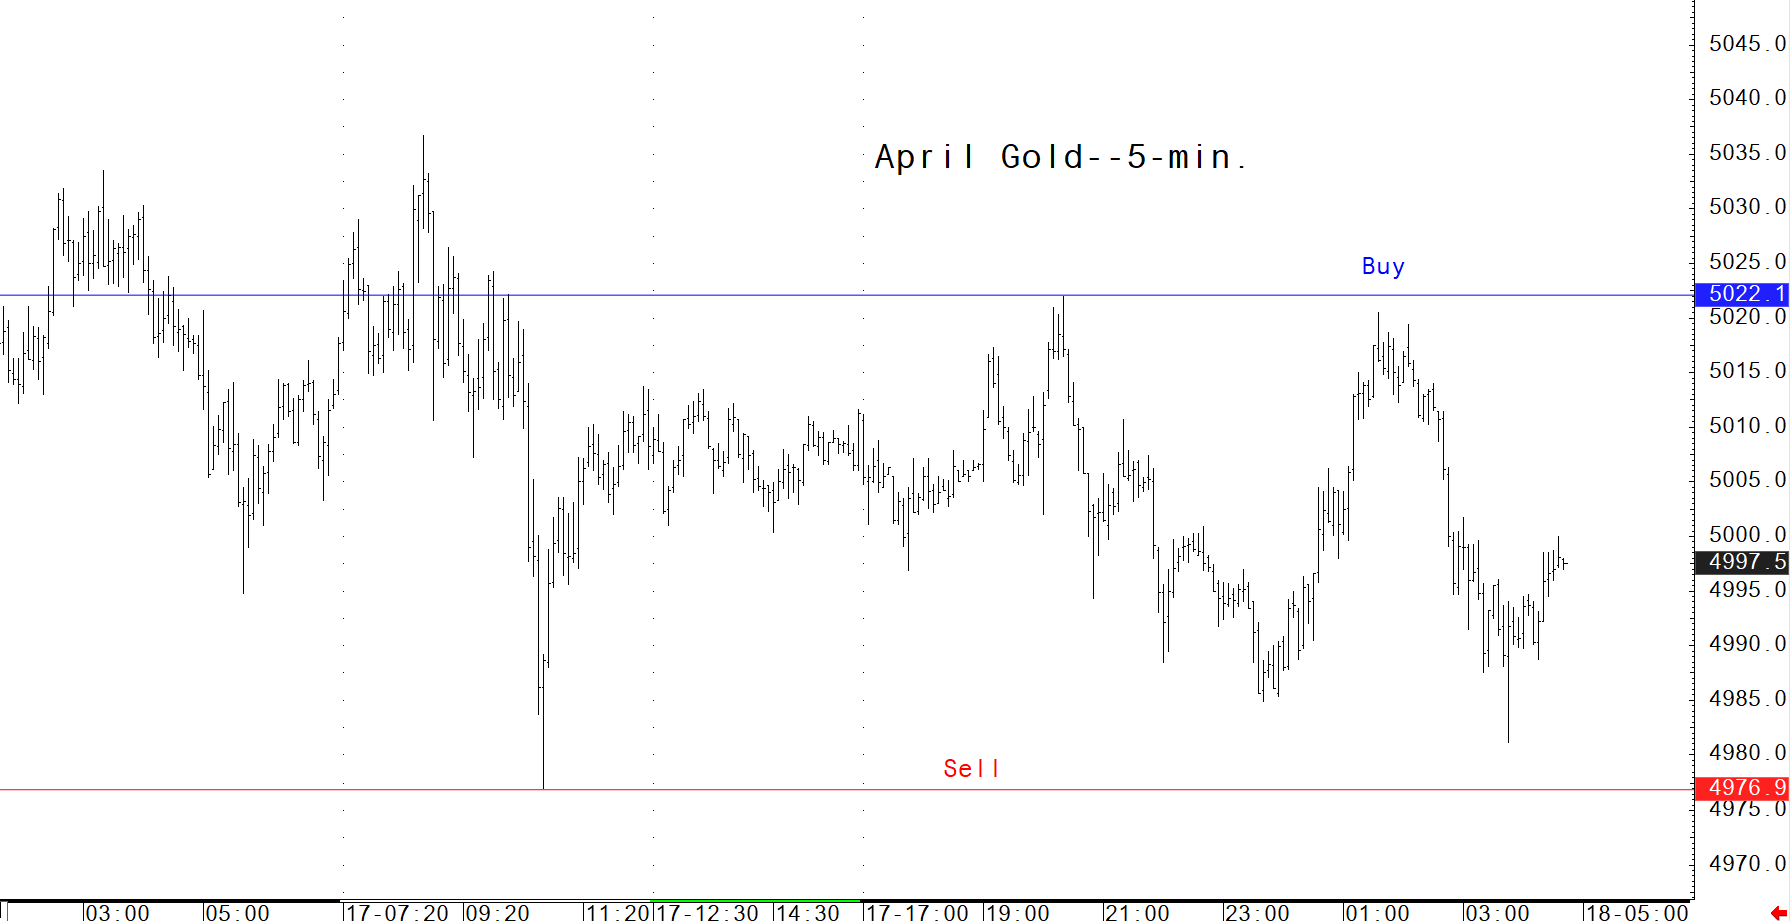
Gold Futures 5-Minute Chart: A Powerful Tool for Traders
If you actively monitor or trade Comex gold futures throughout the day, this 5-minute bar chart offers a unique advantage. It highlights crucial short-term support and resistance levels, helping you pinpoint optimal moments to enter buy or sell positions. Successful traders often capitalize on early signs of price movement—buying when prices begin to rise and selling when weakness emerges. For those seeking a specialized resource to enhance their trading strategies, this exclusive chart is available only at Kitco.

Disclaimer: The content of this article solely reflects the author's opinion and does not represent the platform in any capacity. This article is not intended to serve as a reference for making investment decisions.
You may also like
Trumpflation Is No Longer Just an Gas Story: The US Economy Under Threat

The Boom-Bust Signal From Dot-Com and Housing Is Back, This Time for AI
Gold prices dip Rs 3,200/10 gram; silver falls Rs 6,700/kg as high oil prices raise rate hike bets. Time to sell?
Top 5 Market Catalysts That Could Move Stocks and Crypto This Week
Crypto prices
More


