
What signal is indicated by the simultaneous decline in gold and stocks? Wall Street institutions: Uncertainty peaks, rebound window quietly approaches!

The direction of the current conflict remains unclear, but a research institution says that the market is signaling that uncertainty has reached its peak.
Driven by the consequences of the Iran conflict, the market continues to experience intense volatility. U.S. stocks have fallen to new lows for the year, while concerns about inflation caused by soaring energy prices have led to continued declines in so-called safe-haven assets such as U.S. Treasuries, with yields rising sharply. Even gold has failed to provide a safe haven, with gold prices on Thursday falling to the lowest level since the sharp drop in precious metals in early February.
However, independent investment research firm Variant Perception suggests a shift in market psychology is imminent. They state: “The coming days will mark the ‘peak of uncertainty’ regarding the Iran conflict.”
In a research report sent Thursday evening, the firm believes that the recent movements in some markets have become chaotic, indicating that some traders are being forced to close positions. They point out: “A simple rule for tactical liquidation is when gold and stocks decline simultaneously, which usually signals margin calls or forced selling. We are currently in the tactical liquidation window.”
The firm adds that the sharp rise in short-term interest rates is also unnerving investors. The market has shifted from pricing in several rate cuts this year to starting to factor in the possibility of rate hikes. Recently, the Chicago Board Options Exchange Volatility Index (VIX) has traded higher than VIX futures, which also demonstrates the severity of the current de-risking actions.
All of this is happening as the Iran conflict expands and escalates. This week, oil and gas facilities in the Middle East were bombed, and Qatar has shut down most of its natural gas production, meaning the worst-case scenario has started to become reality.
The institution states: “Damage to critical energy infrastructure and the collapse in ship traffic through the Strait of Hormuz were both unimaginable three weeks ago. Now, both of these have become reality.” This development seems likely to be a defining event signaling the peak of market uncertainty in the coming days.
Deutsche Bank strategist Jim Reid provided a historical data set to explain why crisis-driven selloffs may be nearing an end.
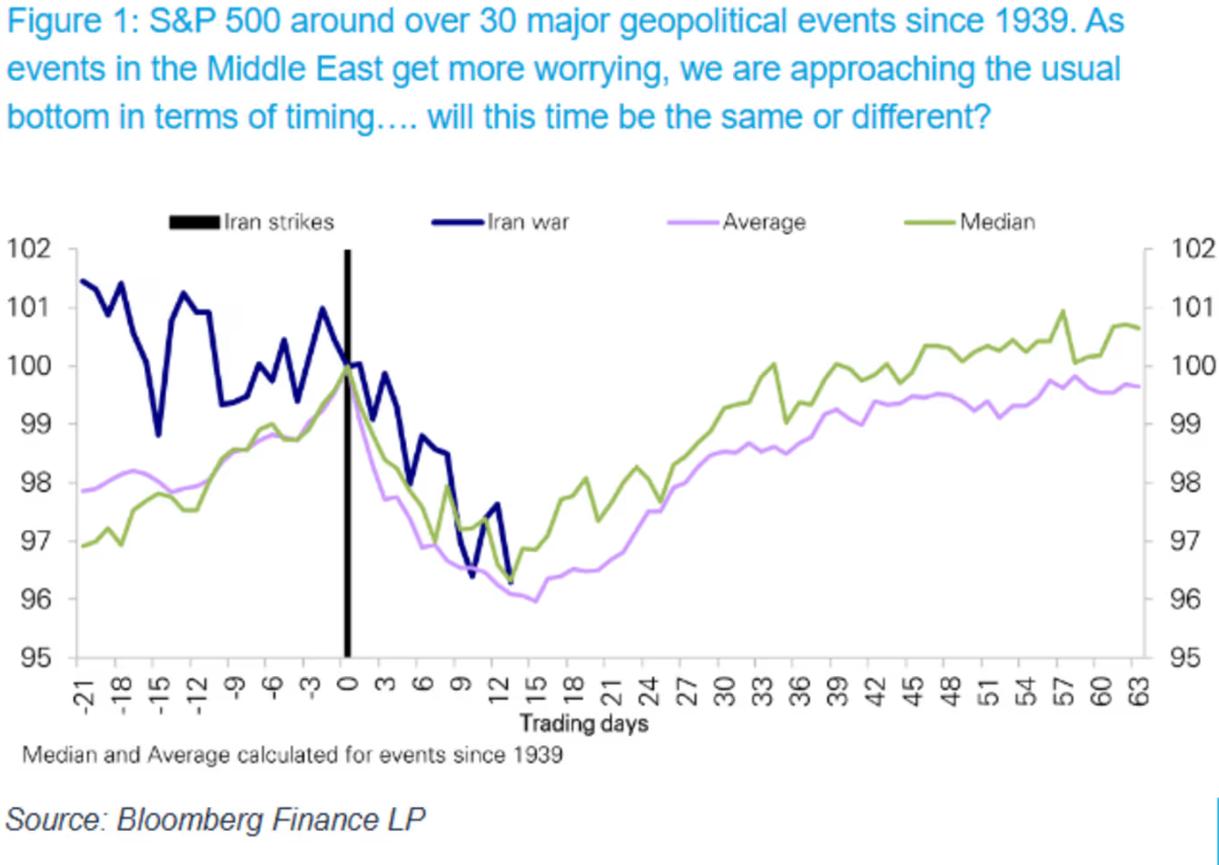 S&P 500’s average performance after 30 major geopolitical events
 Reid’s chart released on Thursday shows the S&P 500’s average performance after 30 major geopolitical events. Reid said: “In terms of timing, the average trough for the S&P 500 tends to occur about three weeks after the initial shock, and we’re approaching that window now. Looking ahead, the median return by day 34 (less than seven weeks after the event) recovers back to pre-shock levels, with the average return also nearly fully recovered by then.”
Disclaimer: The content of this article solely reflects the author's opinion and does not represent the platform in any capacity. This article is not intended to serve as a reference for making investment decisions.
You may also like
Prospects for the opening of the Hormuz Strait are overshadowed, Asian bonds under pressure: 2Y Japanese bond yield approaches 2%, 3Y Korean bond yield rises to highest level since 2022
With high oil prices, short-term bond yields in South Korea and Japan have risen.
5% US Treasury pressure weighs on global assets, while Australian government bonds open up a window for allocation? Fixed income giant Pimco calls the rate hike expectations too aggressive
Pacific Investment Management Company (Pimco) holds a constructive view on Australian bonds, believing that market expectations for rate hikes are too high. Pimco stated that the rate hike cycle in Australia has been "fully priced in," and cracks are beginning to appear in the economy, making Australian bonds look attractive, especially in the 5- to 10-year segment of the yield curve.
Only a few stocks are rising! Goldman Sachs warns: US stock market breadth hits the worst level since the 2000 internet bubble, with rare divergence in bond volatility
Flood, a Goldman Sachs partner, believes that leading AI companies are propping up the market indexes, while median stocks have fallen 16% from their highs. More unusually, Garrett, the head of derivatives trading at Goldman Sachs, warns that the bond volatility MOVE index is at an extremely high percentile, yet the VIX remains subdued. Jonathan Krinsky, a strategist at BTIG, points out that while total hedge fund leverage is rising, net leverage is falling, indicating a contradiction of "increasing exposure without increasing direction," and warns: "Something has to give."
Hyperliquid’s big test: Can institutional demand absorb $100M in whale selling?
Crypto prices
More


