
New Bitcoin price lows 'matter of time' says trader with BTC stuck at $67K

Bitcoin (BTC) circled $67,000 on Sunday as traders warned of hidden BTC price weakness.
Key points:
Bitcoin Bollinger Bands demand a volatile BTC price breakout after a slow weekend.
A trader predicts a move lower thanks to weak support and exposed downside wicks.
Sideways price action comes as sellers step up into the end of the week.
Bitcoin trader waits for sweep of sub-$60,000 lows
Data from TradingView showed volatility cooling over the weekend, with BTC/USD acting within an increasingly narrow range.
On four-hour time frames, the Bollinger Bands volatility indicator constricted — a classic signal that a sharp move up or down was due.
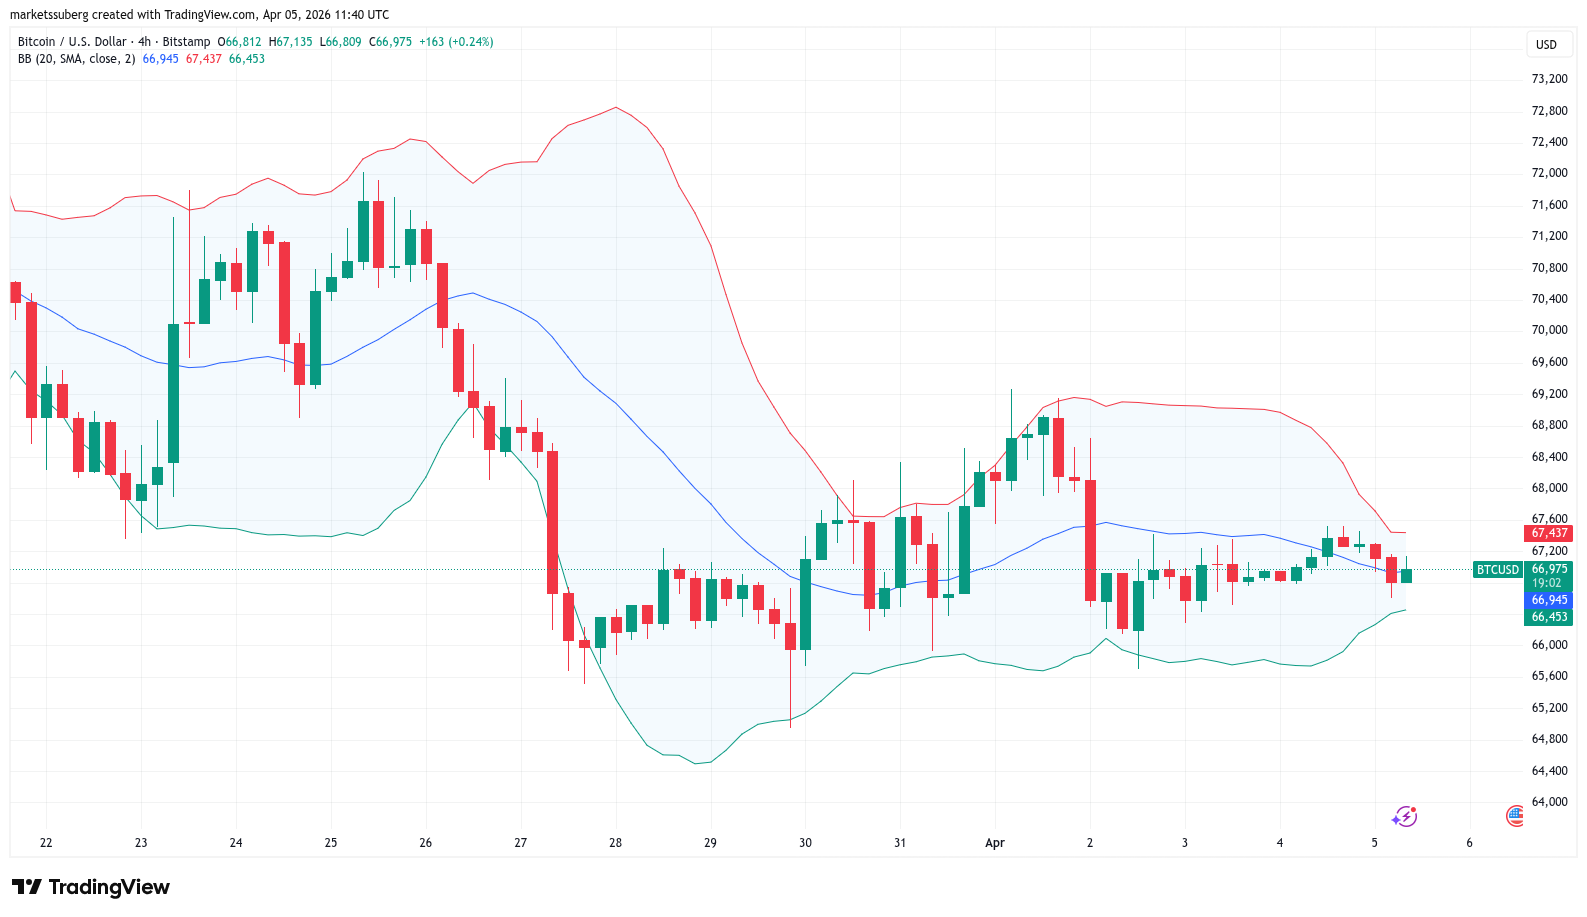 BTC/USD four-hour chart with Bollinger Bands. Source: Cointelegraph/
TradingView
BTC/USD four-hour chart with Bollinger Bands. Source: Cointelegraph/
TradingView
In their latest analysis, pseudonymous trader LP bet on bears winning the battle.
“Looking back at previous cycles, bottoms were formed after multiple sweeps of the lows, forcing capitulation before a reversal,” a post on X read.
“In contrast, this cycle has been doing the opposite, consistently sweeping the highs, making it difficult to enter short positions while leaving the lows exposed and building liquidity below.”
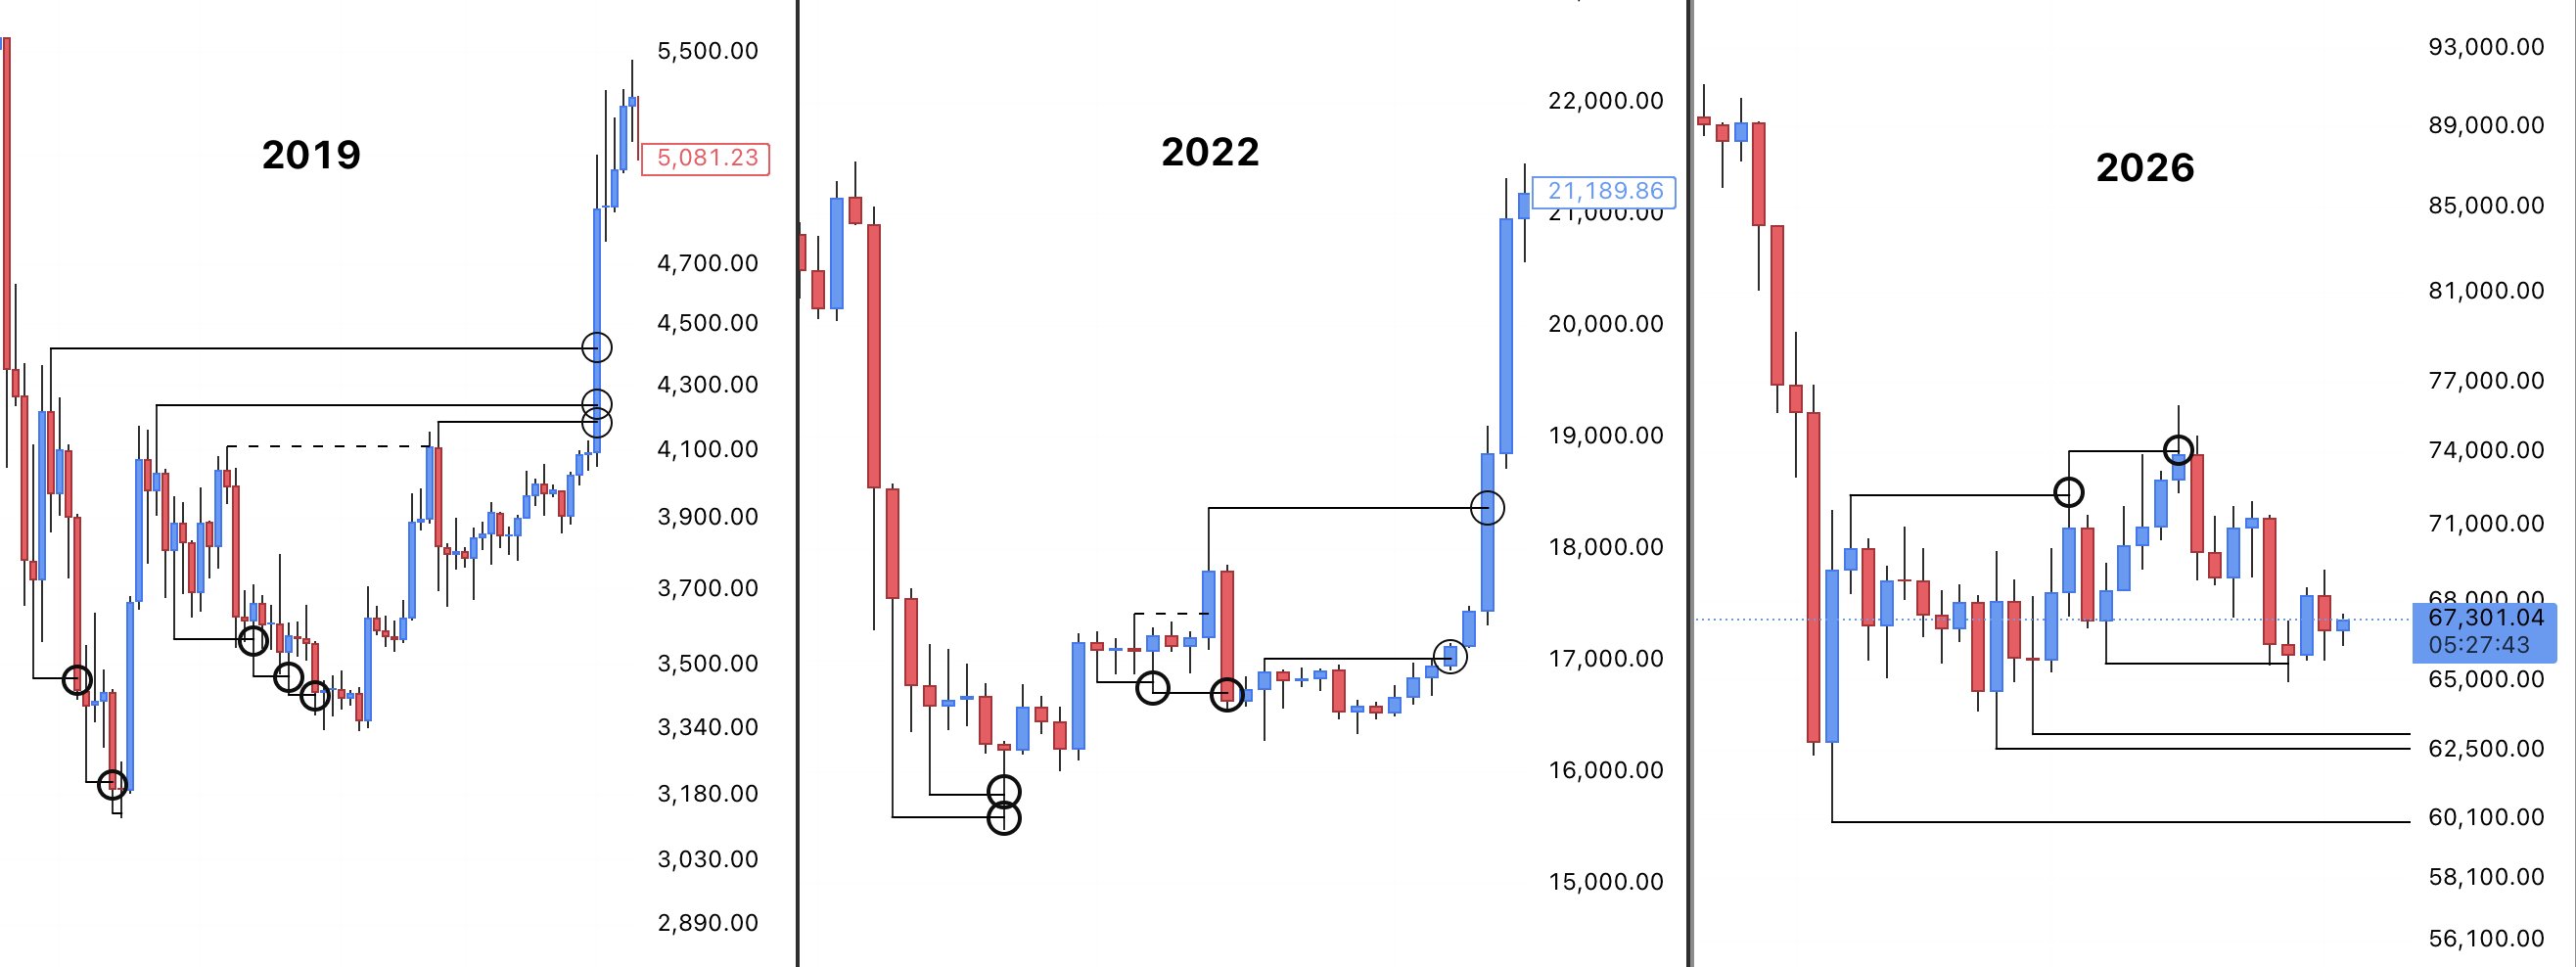 BTC price comparison. Source: LP/X
LP said that sweeping local lows, including February’s wick below $60,000, was “likely just a matter of time.”
“When that breakdown eventually happens, watch the behavior closely. If price starts repeatedly sweeping the lows, making it psychologically difficult to enter longs, that’s when a true bottom is more likely forming,” they concluded.
Whales “buying dips and selling rips” on BTC
Continuing, Keith Alan, cofounder of trading resource Material Indicators, flagged unusual selling activity despite flat BTC price action.
Related: Bitcoin 'done' with 85% crashes, says Cathie Wood amid new $34K target
Uploading a chart of Binance order-book liquidity and volume by investor class, Alan highlighted a bot using time-weighted average price (TWAP) to distribute BTC on Friday.
“The vertical orange line represents the smallest order class with a TWAP bot selling $18M in an hour,” he explained.
“That's exponentially more than their normal $3M-$5M daily volume in 1 hr. That ain't retail!”
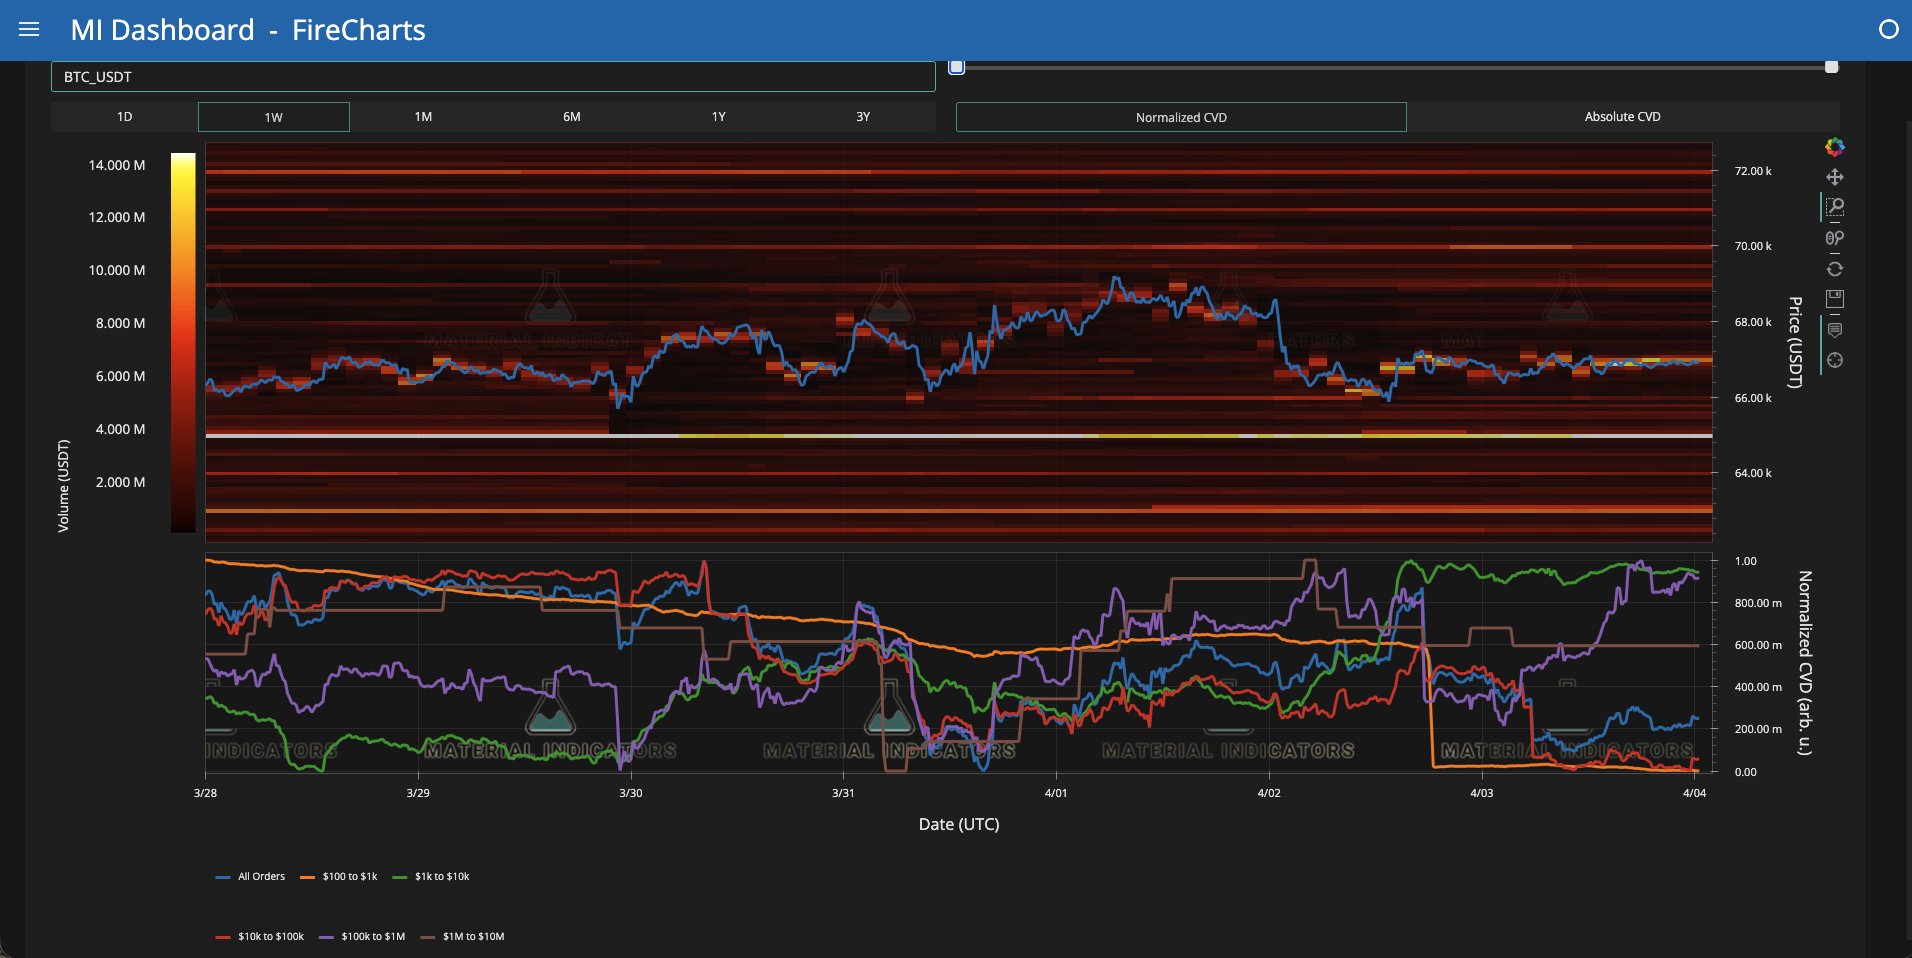 Binance BTC/USDT order-book activity. Source: Keith Alan/X
Whales, Alan added, were “buying dips and selling rips” with Bitcoin still trapped in a range.
Earlier, Cointelegraph reported on further threats to Bitcoin bulls, including resurgent US dollar strength.
Disclaimer: The content of this article solely reflects the author's opinion and does not represent the platform in any capacity. This article is not intended to serve as a reference for making investment decisions.
You may also like
Which Top RWA Tokens Have the Most Real-World Use in 2026?

AI agents drive shift from XRP to stablecoins on XRP Ledger, BlackRock says
Why suspend RMPs? Explanation from New York Fed SOMA Manager Perli
"Agent vs US Treasury" — Who Will Dominate the US Stock Market?
The wave of AI Agents and US Treasury yields are splitting the US stock market into two worlds: Meta's release of the Muse model boosted its market value by $220 billion in a single week, propelling the Nasdaq's standout performance; however, excluding AI stocks, the S&P 500 actually fell 1% this week, with the number of new lows on the New York Stock Exchange surpassing new highs for nine consecutive days, signaling the near end of "breadth trading." Goldman Sachs bluntly stated that this is a "frustrating cat-and-mouse game" between the stock market and interest rates—any breakout can be snuffed out by the bond market at any time, so equity holders must short US Treasury bonds to hedge simultaneously.
Crypto prices
More


