

 ambcrypto.com
LayerZero [$ZRO] jumped 20% to $2.07 as volume surged 125.62% to $87.79 million, reflecting strong market activity during the rally.
However, the rally developed through sharp upward pushes rather than steady progression, showing that price reacted strongly to bursts of demand. This behavior placed greater pressure on price near resistance, where reactions typically intensify as opposing interests begin to emerge.
As the move progressed, the $ZRO price started responding more quickly to nearby levels, reflecting a shift toward shorter-term positioning rather than sustained accumulation.
$ZRO sellers respond before resistance fully breaks
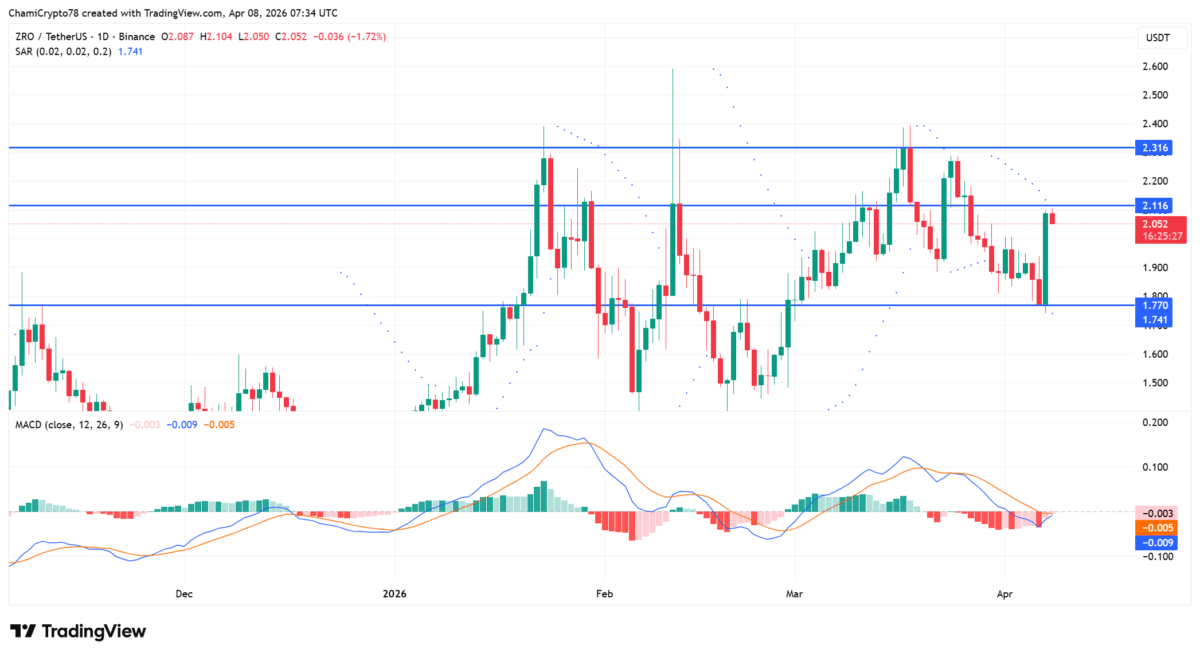
As the rally extended, $ZRO moved toward a critical resistance zone between $2.11 and $2.31. Price held support at $1.77, which acted as a strong base throughout the move.
However, price faced rejection around the $2.05–$2.11 region before reaching the upper boundary. This early reaction showed that sellers had already started defending higher levels. As a result, the structure reflected compression rather than continuation, with price tightening below resistance.
Such a setup increases pressure on both sides, since buyers require stronger follow-through, while sellers attempt to maintain control near the supply zone.
At press time, the MACD line approached the signal line but did not cross, while price held above recent higher lows, showing reduced bearish pressure. In turn, the Parabolic SAR flipped below the price, aligning with the short-term directional change after the rebound.
However, these signals remained transitional, since price continued trading below a key resistance zone.
 Source: TradingView
Leverage builds as traders chase move
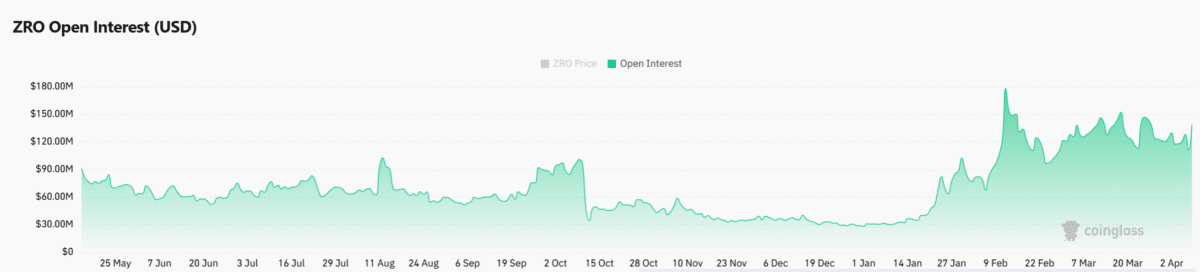
Open Interest (OI) rose 25.27% to $138.25 million as of writing, showing that traders increased leveraged exposure during the rally. This rise indicated that participants entered positions aggressively as price moved higher.
As positioning expanded, price became more sensitive to sudden shifts, since leveraged trades react quickly under pressure. In turn, the structure began reflecting positioning dynamics rather than purely spot-driven demand.
This shift suggests that speculative participation increased, which often amplifies both upward movement and downside reactions depending on how price behaves at resistance.
 Source: CoinGlass
$ZRO long bias grows as sentiment flips
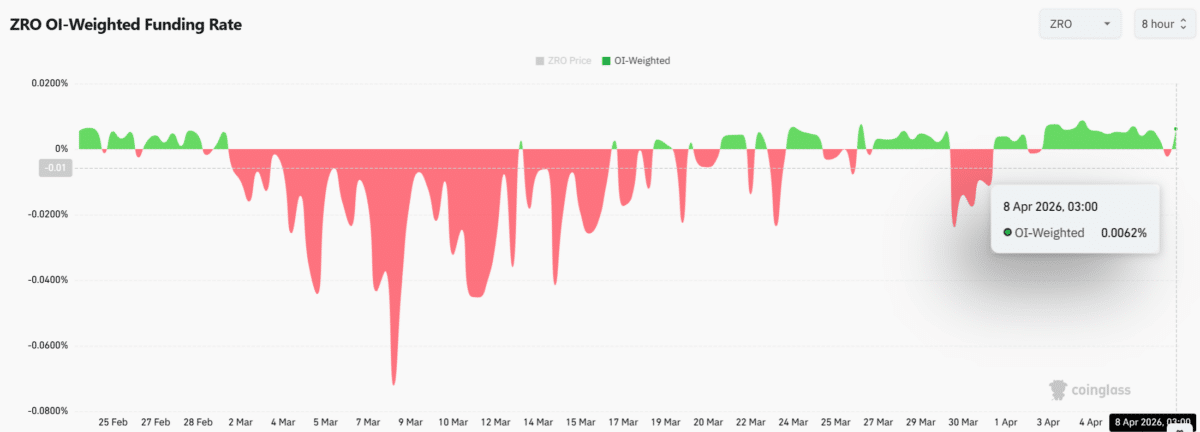
At the time of writing, Funding Rates turned positive, with the OI-Weighted Funding Rate reaching around 0.0062%, indicating that long positions dominated during the move. This shift showed that traders were increasingly positioned for further upside.
However, positive funding also means that longs pay to maintain positions, which often occurs when positioning becomes crowded. As this imbalance developed, price behavior became more dependent on sustained upward pressure.
If price slows near resistance, long positions would likely react quickly, increasing the risk of a sharp repositioning move.
 Source: CoinGlass
$ZRO’s rally drew strong participation, yet price met resistance before confirming continuation.
Indicators showed improving conditions without full confirmation, while rising OI and positive funding pointed to growing reliance on leverage. If the price breaks $2.31, continuation would follow; however, rejection at this level would increase the risk of a pullback toward the $1.77 support zone.
Final Summary
- $ZRO rally shows strong participation, but resistance continues, limiting upward follow-through.
- Rising leverage and positive funding increase the risk of sharp reactions near resistance.





