

-
ETFs and DATs now control nearly 7% of SOL supply
-
Solana price analysis, SOL price prediction, SOL support level, crypto market trends, ETF holdings Solana, DATs crypto, SOL technical analysis, MACD bullish crossover, RSI oversold crypto, altcoin analysis, Solana accumulation, SOL resistance levels
-
Indicators show early signs of bullish momentum building
The Solana price analysis right now feels like a standoff because institutions are quietly loading up, indicators are hinting at a shift, and yet price… just sits there. Hovering around a critical zone, refusing to make the call everyone’s waiting for. So, it’s one of those moments. Calm on the surface, tension underneath.
Institutional Demand For SOL Is Rapidly Rising
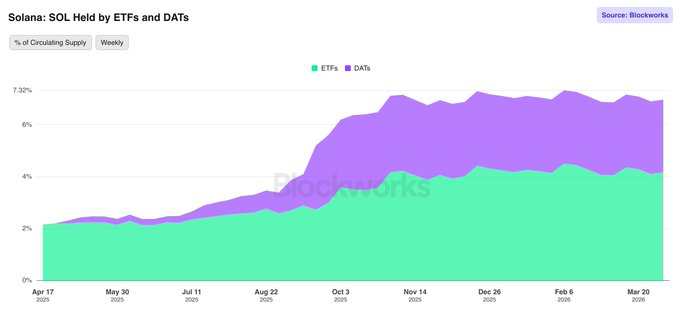
A year ago, ETFs held just 2.15% of SOL, and DATs didn’t even exist. Fast forward to today, and suddenly ETFs control 4.17% while DATs sit at 2.79%. Combined? That’s 6.96% of the circulating supply.
That’s nearly 7%, locked inside structured vehicles. That’s not retail noise. That’s institutional-style exposure scaling fast. And it’s happening while SOL price is still struggling to find a clear direction, which, honestly, makes it even more interesting. Because accumulation rarely looks exciting in real time.
Solana Price Analysis Signals Critical Decision Zone
Now flip over to the weekly chart, and things get… messy. SOL is consolidating right around the $80 region which is a level that previously acted as a strong base back in January 2024. If history decides to rhyme here, this could be the launchpad for a move back toward $200.
But let’s not get carried away. There’s also a descending channel in play, quietly pressing price lower over time. The lower boundary was tested around $67.50 in February 2026. If that structure holds, another visit this time potentially dipping closer to $60 can’t be ruled out.
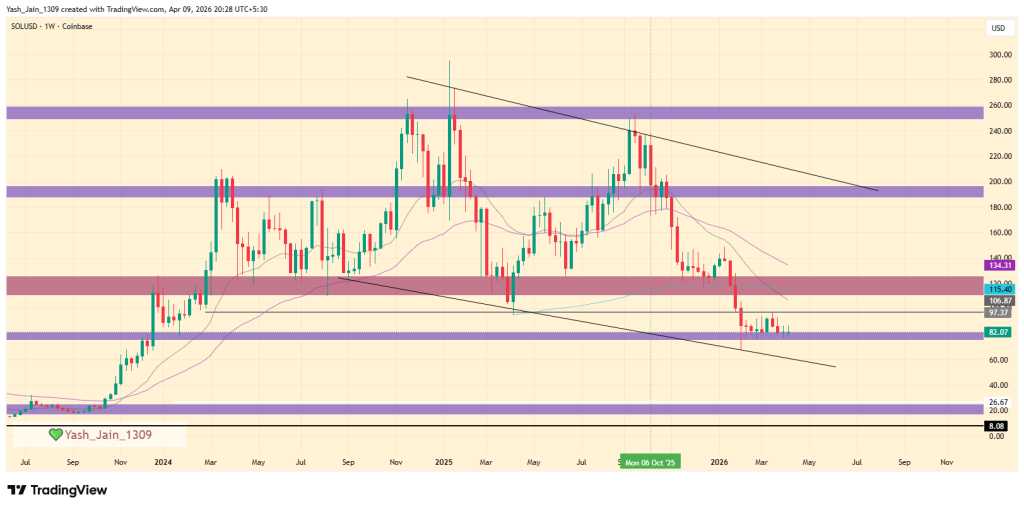
So, it’s a fork in the road: hold $80 and build, or lose it and flush lower.
Indicators Hint At Momentum Slowly Shifting
Here’s where it gets a bit contradictory but in a good way. Like, MACD is on the verge of a bullish crossover. The AO histogram is already flashing early signs of weekly bullish momentum building up. Even CMF, sitting at -0.20, is starting to curve upward, hinting that money might slowly be flowing back in.
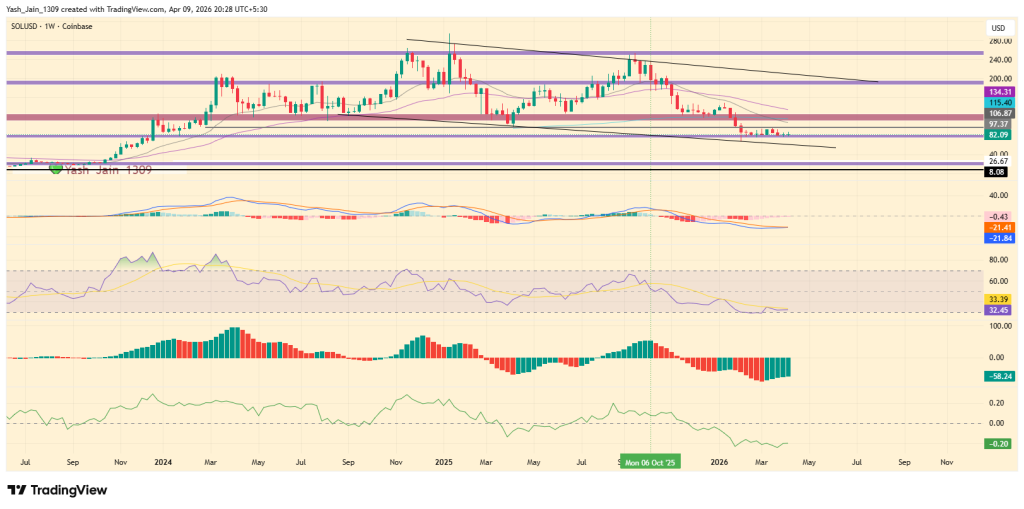
And RSI? Sitting at 32.55. That’s not overheated that’s borderline exhausted.
In other words, momentum indicators are leaning toward a recovery… even if price hasn’t caught up yet.
$80 Or $60 Bottom Debate Intensifies
So, what’s next? Well, it might not even be about Solana itself. Fundamentals aren’t the problem here. Institutional demand is rising, indicators are stabilizing, and the network isn’t exactly lacking momentum.
The real variable? Broader sentiment. Geopolitics. Market mood. If conditions stabilize and $80 holds firm, the path toward $200 starts to look realistic again. But if fear creeps back in and that descending channel stays in control, a sweep toward $60 could be the final shakeout before any meaningful reversal.
Either way, this Solana price analysis isn’t about chasing hype, it’s about watching which level breaks first.





