

-
US CPI printed at a 22-month high, triggering a broad risk-on reaction across Nasdaq, SPX, DXY, and Bitcoin.
-
Bitcoin broke above a key resistance zone, reigniting bullish momentum and opening the path toward $75,000.
Bitcoin price surprised markets with a sharp upside move, reclaiming key resistance levels and pushing toward the $73,000 zone, even as US CPI printed its highest level in 22 months. The reaction caught many off guard, as elevated inflation typically signals tighter financial conditions and downside pressure on risk assets.
Instead, BTC moved higher—tracking strength across US equities and risk markets—raising a critical question: why are markets rallying on seemingly bearish data?
CPI Comes in Hot—But Markets Look Ahead
The latest US CPI came in at ~3.5% YoY (vs. 3.4% expected, 3.2% previous), marking the highest level in nearly two years. Core inflation also remained elevated, reinforcing concerns that price pressures are not cooling fast enough.
Under normal conditions, this would strengthen the case for a hawkish Federal Reserve, delaying rate cuts and tightening liquidity—typically bearish for risk assets like Bitcoin.
However, markets reacted differently.
With traders already positioned cautiously ahead of the release, the data failed to trigger a fresh downside. Instead, it acted as a catalyst for repositioning, allowing Bitcoin and equities to move higher as uncertainty cleared.
Bitcoin Price Analysis: Reclaiming Range High, Eyes on Breakout
Bitcoin has reclaimed the $70K–$72K range high, pushing into the upper boundary of a consolidation zone that has capped price over the past few weeks. This level previously acted as resistance and is now being tested as support, indicating a potential range breakout attempt. The recent move from the $65K liquidity zone shows strong buyer interest, with price forming higher lows and gradually building upward pressure.
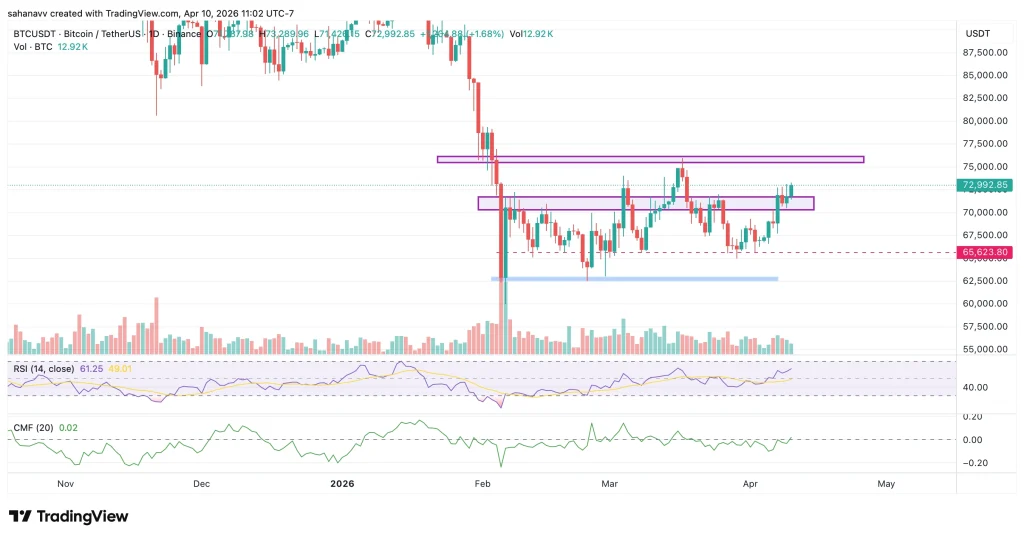
Momentum indicators support the move. RSI is trending above 60, signaling strengthening bullish momentum, while CMF has flipped slightly positive, indicating steady capital inflows. However, price is now approaching a major resistance zone near $75K, which aligns with prior rejection levels. A clean breakout above this level could open the path toward $78K–$80K, while failure to sustain above $70K–$72K risks a pullback toward $65K support.
What’s Next for Bitcoin Price?
Bitcoin’s move highlights a key principle that it reacts to liquidity but not headlines. Despite the hot CPI, selling pressure failed to follow through. Buyers stepped in at key levels, and hence, the price broke above a crucial resistance level. This suggests the market was under-positioned for upside, creating room for a squeeze as shorts got trapped and momentum flipped.
This is no longer about CPI, but it’s about follow-through. If the price holds above the support range between $70,000 to $72,000, continuation remains likely to $75,000. While a failure may initiate a pullback and compel the BTC price to remain consolidated.





