
Bitcoin Signal That Has Predicted Every Bottom Before A Price Explosion Has Just Triggered Again

By:Newsbtc
Bitget offers one-stop trading for cryptocurrencies, stocks, and gold. Trade now!
A welcome pack worth 6200 USDT for new users! Sign up now!
Bitcoin may be approaching another pivotal point in its long-term market cycle, according to a recent analysis shared by crypto analyst @CryptoTice on X. The analyst argues that a time-based signal that historically appeared at major market bottoms has triggered again, a development he suggests has previously preceded large upward expansions in price.
A 14-Month Timing Pattern That Has Marked Bitcoin Bottoms
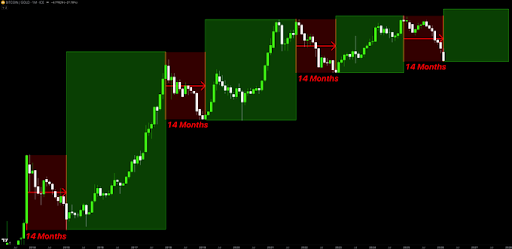
The signal highlighted by CryptoTice centers on a recurring 14-month period that has historically followed Bitcoin’s most significant market downturns. In the chart attached to the analyst’s post, this timeframe appears repeatedly across several market cycles, each instance marked by a red segment labeled “14 Months” followed by a large green expansion box representing the next upward move.

 Source: X
The pattern begins with the 2014 market cycle. After the prolonged decline that followed the 2013 peak, Bitcoin spent roughly fourteen months consolidating before establishing a durable bottom. According to the chart, the market then transitioned into a powerful rally that carried prices into the next major bull phase.
var rnd = window.rnd || Math.floor(Math.random()*10e6); var pid607465 = window.pid607465 || rnd; var plc607465 = window.plc607465 || 0; var abkw = window.abkw || ''; var absrc = 'https://servedbyadbutler.com/adserve/;ID=172179;size=0x0;setID=607465;type=js;sw='+screen.width+';sh='+screen.height+';spr='+window.devicePixelRatio+';kw='+abkw+';pid='+pid607465+';place='+(plc607465++)+';rnd='+rnd+';click=CLICK_MACRO_PLACEHOLDER'; document.write('
');
if (!window.AdButler){(function(){var s = document.createElement("script"); s.async = true; s.type = "text/javascript";s.src = "https://servedbyadbutler.com/app.js";var n = document.getElementsByTagName("script")[0]; n.parentNode.insertBefore(s, n);}());}
var AdButler = AdButler || {}; AdButler.ads = AdButler.ads || []; var abkw = window.abkw || ""; var plc366606 = window.plc366606 || 0; (function(){ var divs = document.querySelectorAll(".plc366606:not([id])"); var div = divs[divs.length-1]; div.id = "placement_366606_"+plc366606; AdButler.ads.push({handler: function(opt){ AdButler.register(172179, 366606, [728,90], "placement_366606_"+opt.place, opt); }, opt: { place: plc366606++, keywords: abkw, domain: "servedbyadbutler.com", click:"CLICK_MACRO_PLACEHOLDER" }}); })();
A similar sequence appeared again after the 2018 bear market. The chart illustrates another fourteen-month stretch between the bottoming phase and the beginning of a major upward trend. Once that period concluded, Bitcoin entered the rally that eventually drove the market to new highs during the 2020–2021 cycle.
The third example referenced in the chart occurs after the 2022 market downturn. Again, the timing window highlighted by the analyst spans approximately fourteen months before the market structure shifted upward.
In each case, the chart visualizes a comparable structure: a defined time interval following a bear-market low, followed by a strong expansion phase. CryptoTice claims that the same timing alignment has now appeared again in 2026.
var rnd = window.rnd || Math.floor(Math.random()*10e6); var pid607472 = window.pid607472 || rnd; var plc607472 = window.plc607472 || 0; var abkw = window.abkw || ''; var absrc = 'https://servedbyadbutler.com/adserve/;ID=172179;size=0x0;setID=607472;type=js;sw='+screen.width+';sh='+screen.height+';spr='+window.devicePixelRatio+';kw='+abkw+';pid='+pid607472+';place='+(plc607472++)+';rnd='+rnd+';click=CLICK_MACRO_PLACEHOLDER'; document.write('
');
if (!window.AdButler){(function(){var s = document.createElement("script"); s.async = true; s.type = "text/javascript";s.src = "https://servedbyadbutler.com/app.js";var n = document.getElementsByTagName("script")[0]; n.parentNode.insertBefore(s, n);}());}
var AdButler = AdButler || {}; AdButler.ads = AdButler.ads || []; var abkw = window.abkw || ""; var plc452518 = window.plc452518 || 0; (function(){ var divs = document.querySelectorAll(".plc452518:not([id])"); var div = divs[divs.length-1]; div.id = "placement_452518_"+plc452518; AdButler.ads.push({handler: function(opt){ AdButler.register(172179, 452518, [728,90], "placement_452518_"+opt.place, opt); }, opt: { place: plc452518++, keywords: abkw, domain: "servedbyadbutler.com", click:"CLICK_MACRO_PLACEHOLDER" }}); })();
Why Analysts Say This Bitcoin Signal Could Matter
The analyst argues that the current cycle has now reached the same 14-month timing window that historically aligned with previous Bitcoin market bottoms. This timing condition alone does not confirm a rally. Instead, it acts as a structural prerequisite that has repeatedly appeared before major upward movements.

It’s Too Early For A Bitcoin Price Bottom, Here’s What You Should Be Looking At
The reasoning behind the signal focuses on broader market dynamics. According to the analysis, several underlying conditions have already unfolded during this period. Market risk has been repriced following previous volatility, excessive leverage within the system has been removed, and overall sentiment has cooled significantly compared to the peak of the previous cycle.
When these factors combine with the historical timing structure, the analyst argues that the market environment begins to resemble previous transition points between bear phases and major bull markets. However, CryptoTice emphasizes that time alignment alone does not guarantee an immediate breakout. Instead, he frames the current moment as a potential opportunity window. If the historical pattern repeats as it did after 2014, 2018, and 2022, the analyst believes the market could once again be approaching the early stage of a major expansion cycle for Bitcoin.
var rnd = window.rnd || Math.floor(Math.random()*10e6); var pid607473 = window.pid607473 || rnd; var plc607473 = window.plc607473 || 0; var abkw = window.abkw || ''; var absrc = 'https://servedbyadbutler.com/adserve/;ID=172179;size=0x0;setID=607473;type=js;sw='+screen.width+';sh='+screen.height+';spr='+window.devicePixelRatio+';kw='+abkw+';pid='+pid607473+';place='+(plc607473++)+';rnd='+rnd+';click=CLICK_MACRO_PLACEHOLDER'; document.write('
');
if (!window.AdButler){(function(){var s = document.createElement("script"); s.async = true; s.type = "text/javascript";s.src = 'https://servedbyadbutler.com/app.js';var n = document.getElementsByTagName("script")[0]; n.parentNode.insertBefore(s, n);}());}
var AdButler = AdButler || {}; AdButler.ads = AdButler.ads || []; var abkw = window.abkw || ''; var plc452519 = window.plc452519 || 0; (function(){ var divs = document.querySelectorAll(".plc452519:not([id])"); var div = divs[divs.length-1]; div.id = "placement_452519_"+plc452519; AdButler.ads.push({handler: function(opt){ AdButler.register(172179, 452519, [728,90], 'placement_452519_'+opt.place, opt); }, opt: { place: plc452519++, keywords: abkw, domain: 'servedbyadbutler.com', click:'CLICK_MACRO_PLACEHOLDER' }}); })();
BTC bulls push for dominance | Source:
0
0
Disclaimer: The content of this article solely reflects the author's opinion and does not represent the platform in any capacity. This article is not intended to serve as a reference for making investment decisions.
Understand the market, then trade.
Bitget offers one-stop trading for cryptocurrencies, stocks, and gold.
Trade now!
You may also like
XRP Pundit: First Thing You Should Do When You Become a Crypto Millionaire
TimesTabloid•2026/09/21 07:03
 VIPTradFi Focus: Where Does the RWA Market Stand Today?
1. Crypto outperformed traditional equity indexes following the rate hike, but elevated interest rates remain a key constraint on cross-asset allocation. From September 12 to 18, BTC, ETH, and SOL gained 4.83%, 3.84%, and 9.96%, respectively, while the S&P 500 edged down 0.08%. The U.S. Dollar Index rose 1.11%, and the 10-year U.S. Treasury yield closed at approximately 4.998%. Improving risk appetite is therefore coexisting with elevated discount rates, raising the bar for RWA allocation: investors need to compare not only returns on the underlying assets, but also on-chain liquidity and collateral efficiency. 2. Growth in tokenized equities is occurring even as the overall RWA market remains under pressure. As of September 18, Distributed Asset Value across RWAs stood at $38.503 billion, down 1.13% week over week, while tokenized equities reached $3.056 billion, up 6.03%. This week's data are better explained by capital reallocating across different RWA segments than by a broad-based expansion of the entire RWA market. 3. For exchanges, the opportunity lies in connecting spot holdings, collateral, and derivatives. Reality's distributed asset value stands at approximately $155 million, while eligible rTokens can already be used within Bitget's UTA margin framework. Across CoinGlass's verifiable sample of 177 TradFi instruments, open interest reached approximately $11.498 billion, up 2.06% week over week, even as weekly trading volume declined 7.60%. The medium-term opportunity remains intact, but deeper utilization will depend on liquidity, collateral use, and sustained trading activity. 4.Assets to watch: BTC, ETH, SOL, NEAR, ZEC, gold, tokenized U.S. equities, COST. 5.Key metrics to watch: rToken collateral utilization, the durability of TradFi open interest and trading volume, and next week's employment and consumer data.
Bitget•2026/09/21 06:38

Gold prices fall Rs 1,331/10 gram, silver dips Rs 1,600/kg as Mideast tensions outweigh oil fall: Key levels to track
EconomicTimes•2026/09/21 04:33
Strategists Say Market's ‘Wall of Worry' Is Healthy, Not a Warning Sign
BeInCrypto•2026/09/21 03:12

Crypto prices
More
Bitcoin
BTC
$81,606.49
+1.66%

Ethereum
ETH
$2,664.12
+3.54%

Tether USDt
USDT
$0.9997
+0.01%

BNB
BNB
$772.2
+2.75%

XRP
XRP
$1.44
+4.13%

USDC
USDC
$0.9999
-0.00%

Solana
SOL
$112.3
+3.39%

TRON
TRX
$0.3428
+0.83%

Zcash
ZEC
$1,506.68
+3.80%

Hyperliquid
HYPE
$94.05
+3.23%
How to buy BTC
Bitget lists BTC – Buy or sell BTC quickly on Bitget!
Trade now
Become a trader now?A welcome pack worth 6200 USDT for new users!
Sign up now