
Bitcoin’s Hidden Backdoor? The Mystery of Satoshi’s “Override” Key

By:Newsbtc
Bitget offers one-stop trading for cryptocurrencies, stocks, and gold. Trade now!
A welcome pack worth 6200 USDT for new users! Sign up now!
The idea of a hidden backdoor in Bitcoin strikes at the very heart of what the network claims to represent: decentralization, transparency, and trustless control. Over the years, a persistent theory has circulated, suggesting that before disappearing, Satoshi Nakamoto may have left behind an override key. This mechanism could theoretically influence or even control the network.
The Mystery Behind Satoshi Nakamoto And The Bitcoin Origins
In the early days of Bitcoin, Satoshi Nakamoto introduced the Key and gave one developer the secret key that could override every BTC node. An analyst known as Sweep, the Co-Founder of GlydeGG, revealed on X that in 2010, after the infamous 184 billion bug coin that nearly collapsed the entire network, Satoshi Nakamoto introduced this key designed to help protect Bitcoin in emergencies.

When a valid was received, BTC clients could enter a form of safe mode, warning users and, in certain cases, limiting normal operation to prevent further damage. Before stepping away, Satoshi transferred this powerful key to Gavin Andresen and also handed over the control of the code repository. Access to the key was reportedly limited to three people: Satoshi Nakamoto, Gavin Andresen, and Theymos.
var rnd = window.rnd || Math.floor(Math.random()*10e6); var pid607465 = window.pid607465 || rnd; var plc607465 = window.plc607465 || 0; var abkw = window.abkw || ''; var absrc = 'https://servedbyadbutler.com/adserve/;ID=172179;size=0x0;setID=607465;type=js;sw='+screen.width+';sh='+screen.height+';spr='+window.devicePixelRatio+';kw='+abkw+';pid='+pid607465+';place='+(plc607465++)+';rnd='+rnd+';click=CLICK_MACRO_PLACEHOLDER'; document.write('
');
if (!window.AdButler){(function(){var s = document.createElement("script"); s.async = true; s.type = "text/javascript";s.src = "https://servedbyadbutler.com/app.js";var n = document.getElementsByTagName("script")[0]; n.parentNode.insertBefore(s, n);}());}
var AdButler = AdButler || {}; AdButler.ads = AdButler.ads || []; var abkw = window.abkw || ""; var plc366606 = window.plc366606 || 0; (function(){ var divs = document.querySelectorAll(".plc366606:not([id])"); var div = divs[divs.length-1]; div.id = "placement_366606_"+plc366606; AdButler.ads.push({handler: function(opt){ AdButler.register(172179, 366606, [728,90], "placement_366606_"+opt.place, opt); }, opt: { place: plc366606++, keywords: abkw, domain: "servedbyadbutler.com", click:"CLICK_MACRO_PLACEHOLDER" }}); })();
 Source:
Chart from Sweep on X
Source:
Chart from Sweep on X
Between 2012 and 2014, the key was used 12 times to issue emergency upgrade notices. This decentralized currency with no central authority had a hidden override switch and was controlled by three individuals for six years.
This mechanism remained in place until the release of BTC version 0.13.0 in 2016, when it was removed as the network matured and no longer required a centralized . Then, in 2018, developers published the key publicly, ensuring it could never be used again in any capacity. Sweep argues that even the most decentralized financial network in history has a hidden backdoor the entire time, and almost nobody knew about it.
How Bitcoin Naturally Gravitates Toward Untapped Liquidity Zones
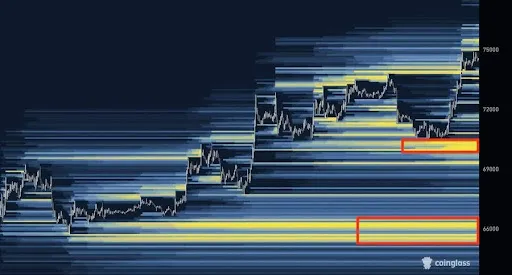
Bitcoin’s price action is currently signaling that the rally is nearing exhaustion because the market has already achieved its primary objective on the upside. Crypto trader Max Trades on X has highlighted that the buyers have aggressively driven the price higher, sweeping through all the major liquidity clusters sitting above. With upside liquidity now largely cleared, the market naturally shifts its focus to where liquidity remains.
var rnd = window.rnd || Math.floor(Math.random()*10e6); var pid607472 = window.pid607472 || rnd; var plc607472 = window.plc607472 || 0; var abkw = window.abkw || ''; var absrc = 'https://servedbyadbutler.com/adserve/;ID=172179;size=0x0;setID=607472;type=js;sw='+screen.width+';sh='+screen.height+';spr='+window.devicePixelRatio+';kw='+abkw+';pid='+pid607472+';place='+(plc607472++)+';rnd='+rnd+';click=CLICK_MACRO_PLACEHOLDER'; document.write('
');
if (!window.AdButler){(function(){var s = document.createElement("script"); s.async = true; s.type = "text/javascript";s.src = "https://servedbyadbutler.com/app.js";var n = document.getElementsByTagName("script")[0]; n.parentNode.insertBefore(s, n);}());}
var AdButler = AdButler || {}; AdButler.ads = AdButler.ads || []; var abkw = window.abkw || ""; var plc452518 = window.plc452518 || 0; (function(){ var divs = document.querySelectorAll(".plc452518:not([id])"); var div = divs[divs.length-1]; div.id = "placement_452518_"+plc452518; AdButler.ads.push({handler: function(opt){ AdButler.register(172179, 452518, [728,90], "placement_452518_"+opt.place, opt); }, opt: { place: plc452518++, keywords: abkw, domain: "servedbyadbutler.com", click:"CLICK_MACRO_PLACEHOLDER" }}); })();

Bitcoin’s Hidden Backdoor? The Mystery of Satoshi’s “Override” Key
According to Max Trades, the first key area sits around $70,000, where a significant liquidity cluster aligns with a strong support level. Below that, another large cluster sits at the range low between $65,000 and $66,000. Even if the bullish trend continues, BTC would see a pullback around the current area and sweep the liquidity around the $70,000 zone.
BTC trading at $73,930 on the 1D chart | Source: BTCUSDT on
Tradingview.com
var rnd = window.rnd || Math.floor(Math.random()*10e6); var pid607473 = window.pid607473 || rnd; var plc607473 = window.plc607473 || 0; var abkw = window.abkw || ''; var absrc = 'https://servedbyadbutler.com/adserve/;ID=172179;size=0x0;setID=607473;type=js;sw='+screen.width+';sh='+screen.height+';spr='+window.devicePixelRatio+';kw='+abkw+';pid='+pid607473+';place='+(plc607473++)+';rnd='+rnd+';click=CLICK_MACRO_PLACEHOLDER'; document.write('
');
if (!window.AdButler){(function(){var s = document.createElement("script"); s.async = true; s.type = "text/javascript";s.src = 'https://servedbyadbutler.com/app.js';var n = document.getElementsByTagName("script")[0]; n.parentNode.insertBefore(s, n);}());}
var AdButler = AdButler || {}; AdButler.ads = AdButler.ads || []; var abkw = window.abkw || ''; var plc452519 = window.plc452519 || 0; (function(){ var divs = document.querySelectorAll(".plc452519:not([id])"); var div = divs[divs.length-1]; div.id = "placement_452519_"+plc452519; AdButler.ads.push({handler: function(opt){ AdButler.register(172179, 452519, [728,90], 'placement_452519_'+opt.place, opt); }, opt: { place: plc452519++, keywords: abkw, domain: 'servedbyadbutler.com', click:'CLICK_MACRO_PLACEHOLDER' }}); })();
0
0
Disclaimer: The content of this article solely reflects the author's opinion and does not represent the platform in any capacity. This article is not intended to serve as a reference for making investment decisions.
Understand the market, then trade.
Bitget offers one-stop trading for cryptocurrencies, stocks, and gold.
Trade now!
You may also like
XRP Pundit: First Thing You Should Do When You Become a Crypto Millionaire
TimesTabloid•2026/09/21 07:03
 VIPTradFi Focus: Where Does the RWA Market Stand Today?
1. Crypto outperformed traditional equity indexes following the rate hike, but elevated interest rates remain a key constraint on cross-asset allocation. From September 12 to 18, BTC, ETH, and SOL gained 4.83%, 3.84%, and 9.96%, respectively, while the S&P 500 edged down 0.08%. The U.S. Dollar Index rose 1.11%, and the 10-year U.S. Treasury yield closed at approximately 4.998%. Improving risk appetite is therefore coexisting with elevated discount rates, raising the bar for RWA allocation: investors need to compare not only returns on the underlying assets, but also on-chain liquidity and collateral efficiency. 2. Growth in tokenized equities is occurring even as the overall RWA market remains under pressure. As of September 18, Distributed Asset Value across RWAs stood at $38.503 billion, down 1.13% week over week, while tokenized equities reached $3.056 billion, up 6.03%. This week's data are better explained by capital reallocating across different RWA segments than by a broad-based expansion of the entire RWA market. 3. For exchanges, the opportunity lies in connecting spot holdings, collateral, and derivatives. Reality's distributed asset value stands at approximately $155 million, while eligible rTokens can already be used within Bitget's UTA margin framework. Across CoinGlass's verifiable sample of 177 TradFi instruments, open interest reached approximately $11.498 billion, up 2.06% week over week, even as weekly trading volume declined 7.60%. The medium-term opportunity remains intact, but deeper utilization will depend on liquidity, collateral use, and sustained trading activity. 4.Assets to watch: BTC, ETH, SOL, NEAR, ZEC, gold, tokenized U.S. equities, COST. 5.Key metrics to watch: rToken collateral utilization, the durability of TradFi open interest and trading volume, and next week's employment and consumer data.
Bitget•2026/09/21 06:38

Gold prices fall Rs 1,331/10 gram, silver dips Rs 1,600/kg as Mideast tensions outweigh oil fall: Key levels to track
EconomicTimes•2026/09/21 04:33
Strategists Say Market's ‘Wall of Worry' Is Healthy, Not a Warning Sign
BeInCrypto•2026/09/21 03:12

Crypto prices
More
Bitcoin
BTC
$81,481.5
+1.45%

Ethereum
ETH
$2,647.46
+2.79%

Tether USDt
USDT
$0.9997
+0.01%

BNB
BNB
$767.18
+2.48%

XRP
XRP
$1.44
+4.03%

USDC
USDC
$0.9999
-0.01%

Solana
SOL
$111.5
+2.69%

TRON
TRX
$0.3431
+0.62%

Zcash
ZEC
$1,488.17
+2.76%

Hyperliquid
HYPE
$93.94
+2.88%
How to buy BTC
Bitget lists BTC – Buy or sell BTC quickly on Bitget!
Trade now
Become a trader now?A welcome pack worth 6200 USDT for new users!
Sign up now