Bitget App
Trade smarter
Buy cryptoMarketsTradeFuturesEarnAISquareMore
Stellar Price Forecast: Bullish momentum builds with technical breakout, high quarterly transaction activity

Stellar Price Forecast: Bullish momentum builds with technical breakout, high quarterly transaction activity

CryptoNewsNetCryptoNewsNet2026/04/17 23:03
By:CryptoNewsNet
Back to the list

Stellar Price Forecast: Bullish momentum builds with technical breakout, high quarterly transaction activity

Stellar Price Forecast: Bullish momentum builds with technical breakout, high quarterly transaction activity image 0  fxstreet.com 23 m
Stellar Price Forecast: Bullish momentum builds with technical breakout, high quarterly transaction activity image 1

Stellar ($XLM) price trades slightly down at $0.167 on Friday, after breaking above the descending trendline and rallying over 10% so far this week. The bullish sentiment builds as $XLM’s network transactions reach a quarterly high, alongside positive funding rates and bullish momentum indicators.

Surge in network activity

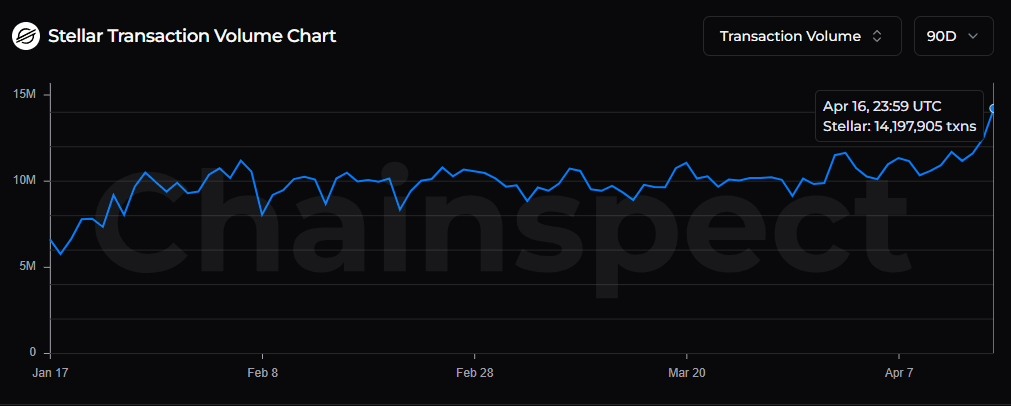
Chainspect, a blockchain fundamentals tracker, data shows that Stellar processed over 14.19 million transactions on Thursday, its highest level in the past quarter. These surging transactions highlight increased interest and liquidity among traders in the $XLM, supporting a bullish outlook.
Stellar Price Forecast: Bullish momentum builds with technical breakout, high quarterly transaction activity image 2
Stellar transaction volume chart. Source: Chainspect

On the derivative side, $XLM funding rates have also flipped positive on Monday and read at 0.011% on Friday, indicating the longs are paying the shorts. Historically, when funding rates have turned positive and surged, $XLM price has rallied sharply.
Stellar Price Forecast: Bullish momentum builds with technical breakout, high quarterly transaction activity image 3
$XLM funding rates chart. Source: Coinglass

$XLM Price Forecast: Price action shows a bullish breakout in play

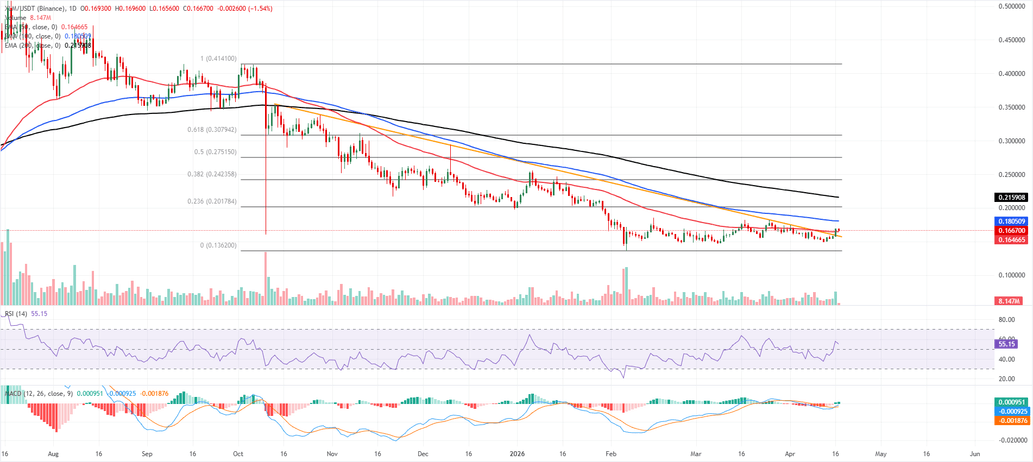
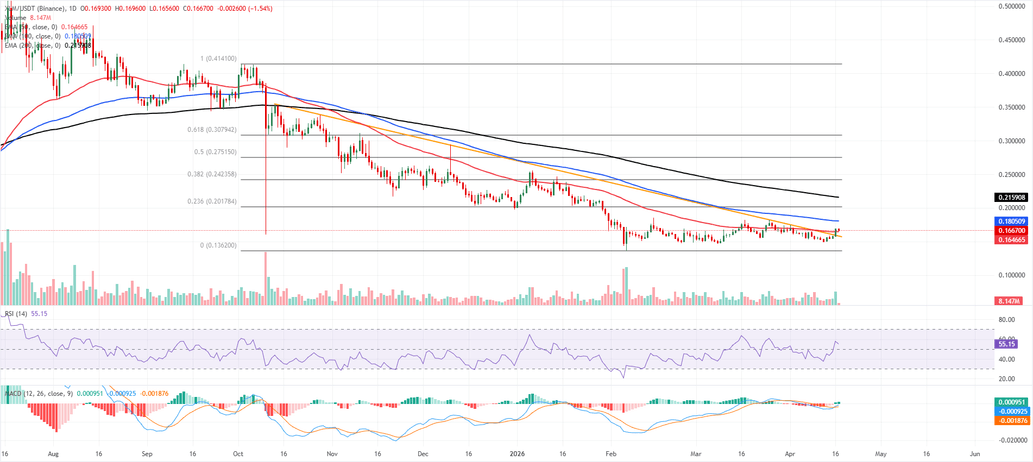
Stellar price is trading at $0.166 on Friday, after breaking above the descending trendline at $0.1580 the previous day. $XLM is maintaining a corrective tone below the medium- and long-term Exponential Moving Averages (EMAs) as the current price remains capped beneath the 100-day EMA at $0.180 and well under the 200-day EMA at $0.215.

The 50-day EMA at $0.164 now offers nearby dynamic support, while the Relative Strength Index (RSI) around 55 and a slightly positive Moving Average Convergence Divergence (MACD) histogram hint that downside momentum has faded but not yet flipped the structure.

On the topside, initial resistance is seen at the 100-day EMA around $0.180, followed by the 23.6% Fibonacci retracement of the broader downswing at $0.201 and the 200-day EMA near $0.2159. Higher up, additional Fibonacci barriers cluster at $0.242 and $0.275, with deeper retracement hurdles at $0.307.

On the downside, immediate support is provided by the 50-day EMA at $0.164, ahead of the former trendline break area near $0.158; a loss of this zone would expose the $0.136 swing low region, where the Fibonacci anchor creates a more substantial floor.
Stellar Price Forecast: Bullish momentum builds with technical breakout, high quarterly transaction activity image 4

(The technical analysis of this story was written with the help of an AI tool.)

0
0

Disclaimer: The content of this article solely reflects the author's opinion and does not represent the platform in any capacity. This article is not intended to serve as a reference for making investment decisions.

Understand the market, then trade.
Bitget offers one-stop trading for cryptocurrencies, stocks, and gold.
Trade now!

You may also like

VIPTradFi Focus: Where Does the RWA Market Stand Today?

1. Crypto outperformed traditional equity indexes following the rate hike, but elevated interest rates remain a key constraint on cross-asset allocation. From September 12 to 18, BTC, ETH, and SOL gained 4.83%, 3.84%, and 9.96%, respectively, while the S&P 500 edged down 0.08%. The U.S. Dollar Index rose 1.11%, and the 10-year U.S. Treasury yield closed at approximately 4.998%. Improving risk appetite is therefore coexisting with elevated discount rates, raising the bar for RWA allocation: investors need to compare not only returns on the underlying assets, but also on-chain liquidity and collateral efficiency. 2. Growth in tokenized equities is occurring even as the overall RWA market remains under pressure. As of September 18, Distributed Asset Value across RWAs stood at $38.503 billion, down 1.13% week over week, while tokenized equities reached $3.056 billion, up 6.03%. This week's data are better explained by capital reallocating across different RWA segments than by a broad-based expansion of the entire RWA market. 3. For exchanges, the opportunity lies in connecting spot holdings, collateral, and derivatives. Reality's distributed asset value stands at approximately $155 million, while eligible rTokens can already be used within Bitget's UTA margin framework. Across CoinGlass's verifiable sample of 177 TradFi instruments, open interest reached approximately $11.498 billion, up 2.06% week over week, even as weekly trading volume declined 7.60%. The medium-term opportunity remains intact, but deeper utilization will depend on liquidity, collateral use, and sustained trading activity. 4.Assets to watch: BTC, ETH, SOL, NEAR, ZEC, gold, tokenized U.S. equities, COST. 5.Key metrics to watch: rToken collateral utilization, the durability of TradFi open interest and trading volume, and next week's employment and consumer data.

Bitget2026/09/21 06:38
TradFi Focus: Where Does the RWA Market Stand Today?