

 ambcrypto.com
Siren [$SIREN] rallied sharply over the past 24 hours, rising 17% at the time of writing. The move reflects more than just a short-term surge; it indicates a structural shift in positioning, with bearish bets unwinding and the directional bias tilting to the upside.
Shorts unwind as positioning flips
Derivatives data shows a clear contraction in market exposure even as price trends higher. According to CoinGlass, $SIREN’s Open Interest (OI) declined by roughly 15% to $7.59 million over the past day.
Under normal conditions, falling OI aligns with weakening prices and bearish sentiment. Here, the opposite occurs. Price expansion alongside declining OI suggests that traders, particularly shorts, are actively closing positions rather than being liquidated.
Liquidations totaled $267,430 over the same period, a modest figure relative to the scale of the move. This reinforces the view that the market is seeing voluntary exits, not forced deleveraging.
 Source: CoinGlass
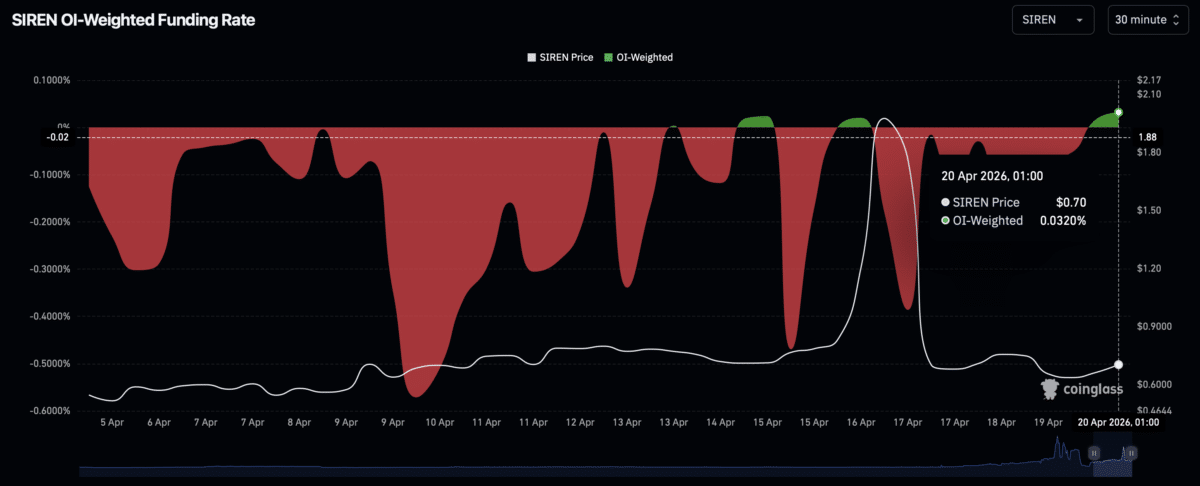
Positioning metrics support this shift. At press time, the Weighted Funding Rate relative to OI remained positive at 0.0320%, while the Taker Buy/Sell Ratio stood at 1.06. These indicators show that capital flow and execution volume now favor long exposure.
Range dynamics frame the next move
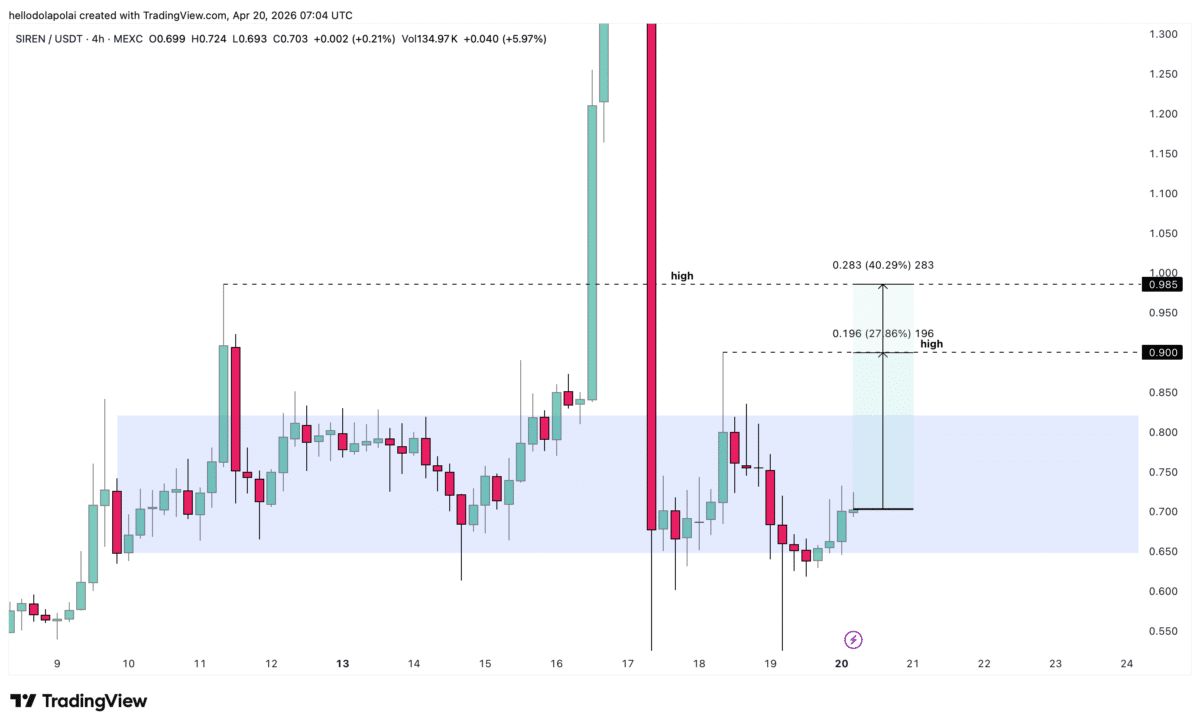
Price action continues to respect a defined trading range, with the latest rally originating from the lower boundary. This reaction strengthens the case for a continuation move toward higher levels within the structure.
A push toward the recent breakout zone would imply a potential 28% advance from current levels. A sustained move beyond that region could extend gains toward the 40% range.
 Source: TradingView
Even a conservative move to the top of the current range represents a 16% upside.
However, historical price behavior within this range warrants caution. Previous approaches to the upper boundary have resulted in rejection and subsequent pullbacks. The same pattern could repeat if buying pressure weakens near resistance.
Momentum and inflows support continuation
Momentum and capital flow indicators continue to align with a bullish outlook.
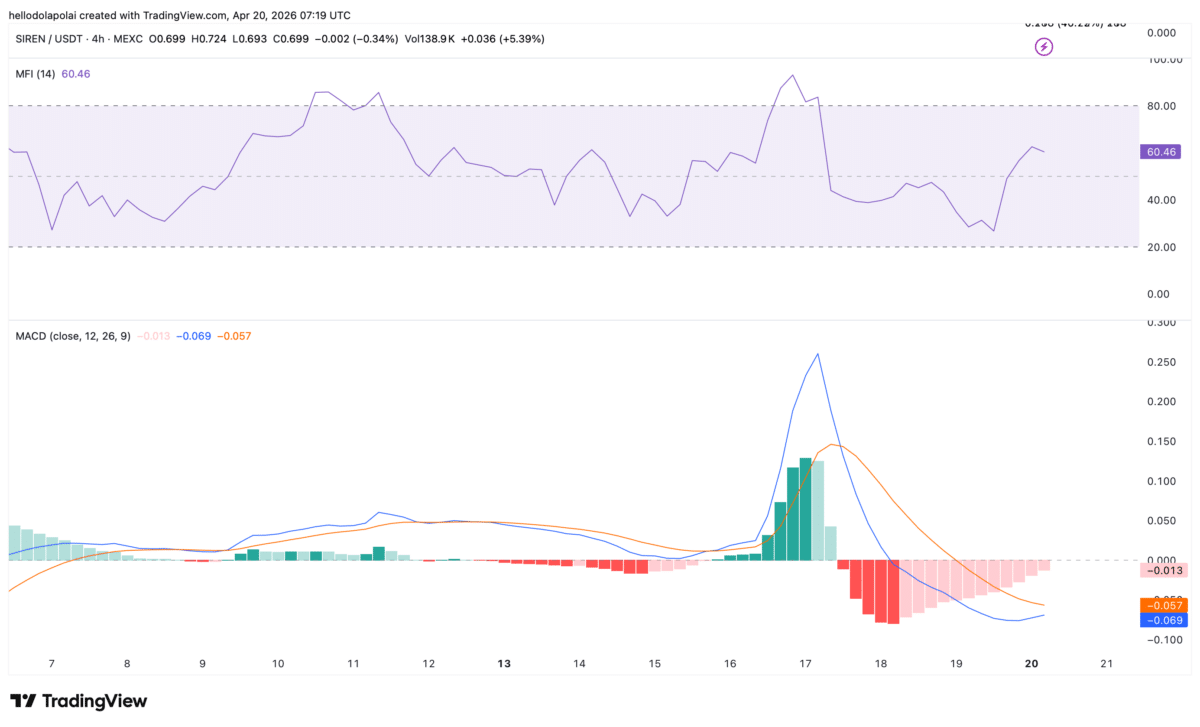
At the time of writing, the Money Flow Index (MFI) read 60.46, placing it firmly in positive territory. This suggests that capital inflows remain intact despite a minor retracement in the past day.
 Source: TradingView
Meanwhile, the Moving Average Convergence Divergence (MACD) reflected a shift in momentum. The histogram has faded from deep red to a lighter shade, indicating that bearish pressure is losing strength.
At the same time, the MACD line was on the verge of crossing above the signal line, a development typically associated with trend continuation to the upside.
Final Summary
- $SIREN posts strong gains as short traders exit positions at scale.
- Momentum indicators point to building bullish strength, with 16%–40% upside still in play.





