
Bitget App
Trade smarter
Buy cryptoMarketsTradeFuturesEarnAISquareMore
Stellar faces bearish pressure as sellers target breakdown below $0.1500

Stellar faces bearish pressure as sellers target breakdown below $0.1500

CryptoNewsNetCryptoNewsNet2026/04/23 13:33
By:CryptoNewsNet
Back to the list

Stellar faces bearish pressure as sellers target breakdown below $0.1500

  coinjournal.net 32 m
Stellar faces bearish pressure as sellers target breakdown below $0.1500 image 0

Key takeaways

  • $XLM is down 2% on Thursday after the 100-day EMA capped its short-term recovery run.
  • $XLM futures Open Interest stabilizes, but the declining long-to-short ratio signals a bearish bias.

$XLM flips bearish as the leverage market loses confidence

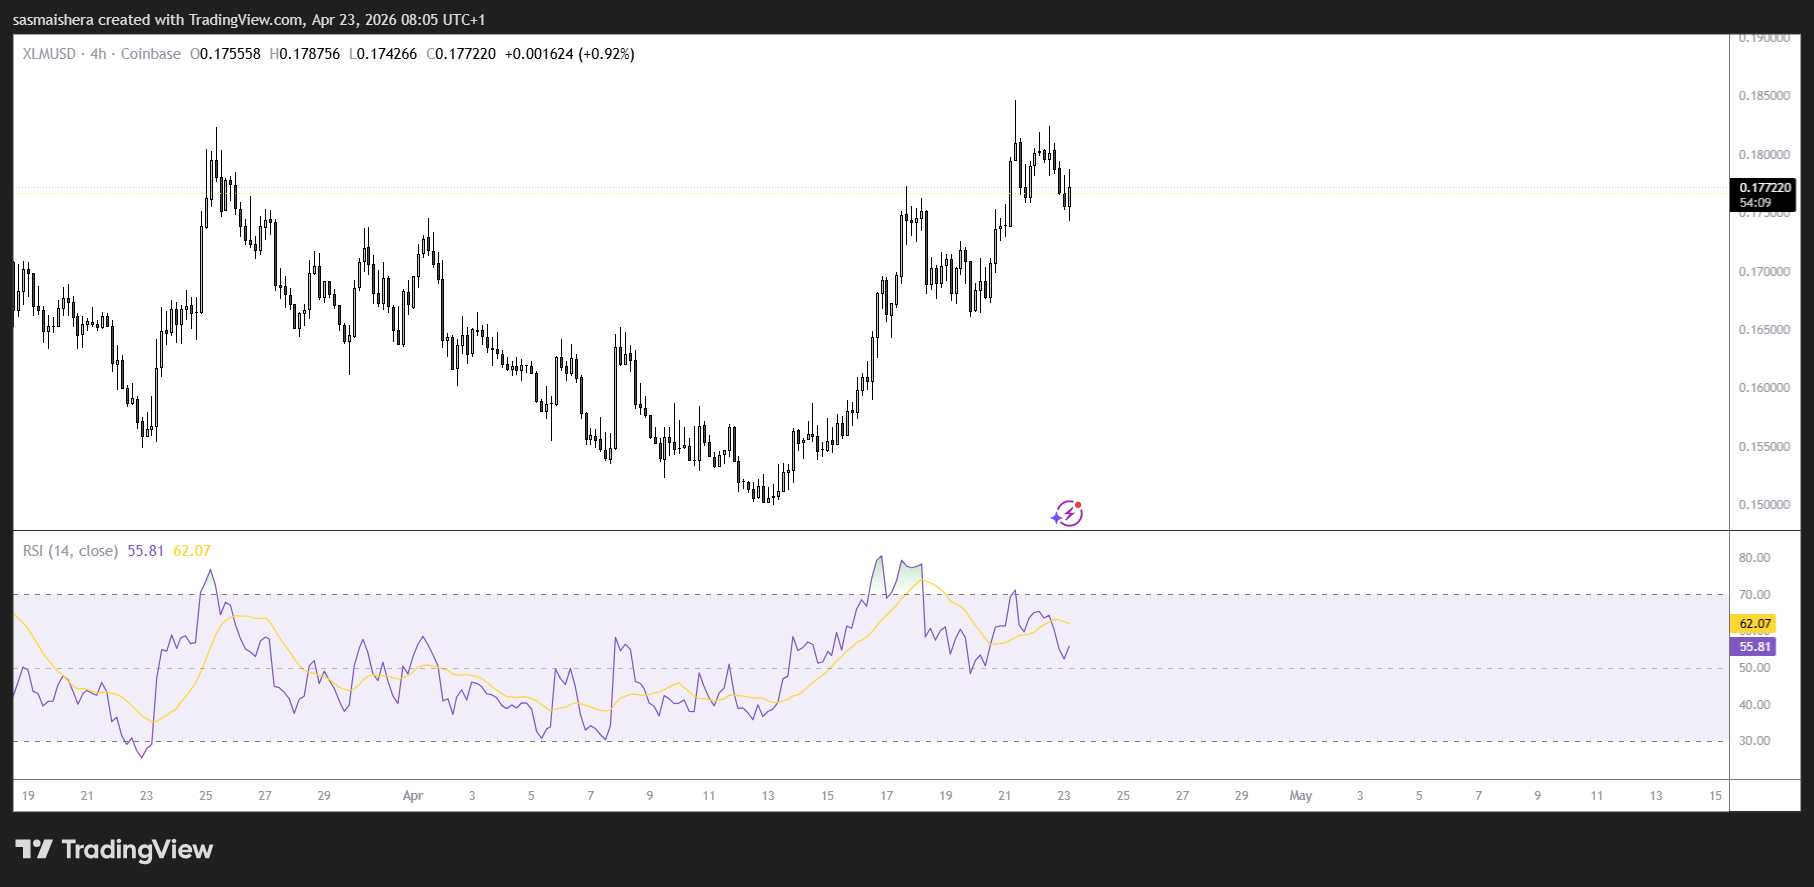
Stellar ($XLM) extended its losses on Thursday, with the token struggling to regain momentum as the 100-day Exponential Moving Average (EMA) near $0.1798 continues to cap upside attempts, reinforcing a bearish short-term outlook.

Sentiment in the derivatives market also points to growing downside expectations. Data from Coinglass shows that $XLM futures Open Interest (OI) remains elevated at $114.70 million after climbing sharply from $99.45 million earlier this week, signaling sustained trader activity despite weak price action.

However, bearish positioning continues to dominate. The long-to-short ratio currently sits at 0.7632 — a level that has remained below 1 since mid-January — indicating that traders are increasingly favoring short positions and anticipating further downside for $XLM.

Technical forecast: $XLM could drop below $0.1700

The $XLM/USD 4-hour chart remains bearish and efficient, indicating that the bears have regained control in the near term.

$XLM is trading below the key 100-day EMA while still holding above the 50-day EMA at $0.1669.

Momentum indicators still show some signs of resilience. The Relative Strength Index (RSI) is hovering around 62 on the 4-hour timeframe, remaining above the neutral midpoint, while the Moving Average Convergence Divergence (MACD) indicator continues to trade above its signal line, suggesting buyers have not fully lost control.

Still, downside risks remain elevated. If $XLM falls below the 50-day EMA support at $0.1669, the token could slide toward the key consolidation support zone at $0.1471 — a level that has held since early February.
Stellar faces bearish pressure as sellers target breakdown below $0.1500 image 1

On the upside, bulls would need to push $XLM above the 100-day EMA at $0.1798 to uphold a bullish sentiment.

A daily candle close above that resistance could pave the way for a move toward the 200-day EMA near $0.2101.


0
0

Disclaimer: The content of this article solely reflects the author's opinion and does not represent the platform in any capacity. This article is not intended to serve as a reference for making investment decisions.

Understand the market, then trade.
Bitget offers one-stop trading for cryptocurrencies, stocks, and gold.
Trade now!

You may also like

VIPTradFi Focus: Where Does the RWA Market Stand Today?

1. Crypto outperformed traditional equity indexes following the rate hike, but elevated interest rates remain a key constraint on cross-asset allocation. From September 12 to 18, BTC, ETH, and SOL gained 4.83%, 3.84%, and 9.96%, respectively, while the S&P 500 edged down 0.08%. The U.S. Dollar Index rose 1.11%, and the 10-year U.S. Treasury yield closed at approximately 4.998%. Improving risk appetite is therefore coexisting with elevated discount rates, raising the bar for RWA allocation: investors need to compare not only returns on the underlying assets, but also on-chain liquidity and collateral efficiency. 2. Growth in tokenized equities is occurring even as the overall RWA market remains under pressure. As of September 18, Distributed Asset Value across RWAs stood at $38.503 billion, down 1.13% week over week, while tokenized equities reached $3.056 billion, up 6.03%. This week's data are better explained by capital reallocating across different RWA segments than by a broad-based expansion of the entire RWA market. 3. For exchanges, the opportunity lies in connecting spot holdings, collateral, and derivatives. Reality's distributed asset value stands at approximately $155 million, while eligible rTokens can already be used within Bitget's UTA margin framework. Across CoinGlass's verifiable sample of 177 TradFi instruments, open interest reached approximately $11.498 billion, up 2.06% week over week, even as weekly trading volume declined 7.60%. The medium-term opportunity remains intact, but deeper utilization will depend on liquidity, collateral use, and sustained trading activity. 4.Assets to watch: BTC, ETH, SOL, NEAR, ZEC, gold, tokenized U.S. equities, COST. 5.Key metrics to watch: rToken collateral utilization, the durability of TradFi open interest and trading volume, and next week's employment and consumer data.

Bitget2026/09/21 06:38
TradFi Focus: Where Does the RWA Market Stand Today?
