

 ambcrypto.com
$RAVE surged 13.44% to $1.05, pushing market cap toward $261.63M as activity shifted.
However, trading volume declined by 22%, falling to nearly $139M during the move. This divergence showed that fewer participants supported the price expansion.
Buyers drove prices higher, yet broader market engagement did not follow through. As a result, the rally appeared less organic and more concentrated.
Such conditions often reflect liquidity-driven moves rather than sustained demand. Although $RAVE’s price strength remained visible, declining volume suggested hesitation among participants.
This imbalance between price and volume raised concerns about the durability of the upside move.
Longs dominate as trader conviction intensifies
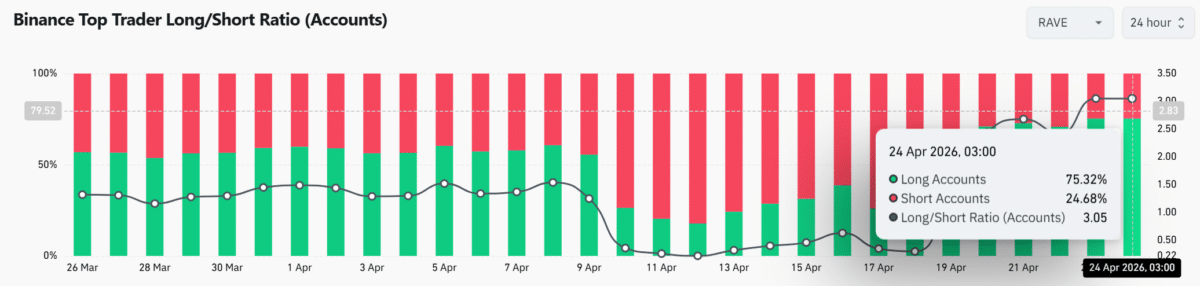
Binance top traders increased long exposure aggressively, pushing the Long/Short Ratio to 3.05. Long accounts accounted for 75.32%, while short positions stood at 24.68%.
This sharp skew reflected strong directional conviction among dominant market participants. However, such positioning also introduced crowding risk on the long side.
When positioning becomes heavily one-sided, the market often becomes vulnerable to sharp reactions.
In this case, traders showed confidence in further upside despite weakening volume conditions.
Even so, the imbalance suggested that many participants entered similar trades simultaneously. This clustering of positions could amplify volatility if price fails to sustain higher levels.
 Source: CoinGlass
$RAVE struggles below broken macro structure
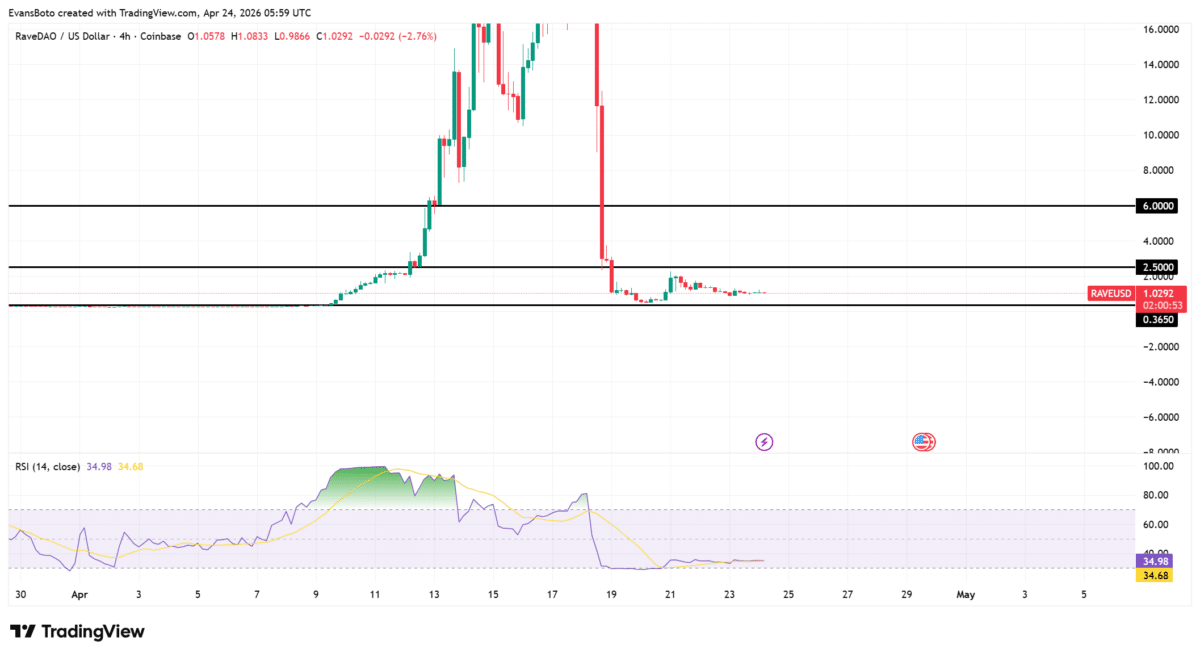
Price stabilized near $1.05 after collapsing from macro highs near $6.00. The breakdown below $2.50 marked a clear shift in structure, as prior support turned into resistance.
Since then, $RAVE has consolidated within a compressed range around $1.00. This stabilization phase reflected reduced volatility after the sharp decline.
However, the inability to reclaim higher levels showed that bullish control remained limited. The market transitioned from expansion into consolidation, with prices failing to establish a new upward trend.
As a result, $RAVE continued trading within a weakened structure rather than rebuilding strength above key resistance zones.
The Relative Strength Index remained suppressed near 35, reflecting weak buyer strength. Previously, RSI climbed toward overbought levels during the rally before the breakdown.
However, it dropped sharply and failed to recover above the neutral 50 level. This behavior indicated that buying pressure remained limited despite the recent price bounce.
 Source: TradingView
Negative funding reveals hidden market tension
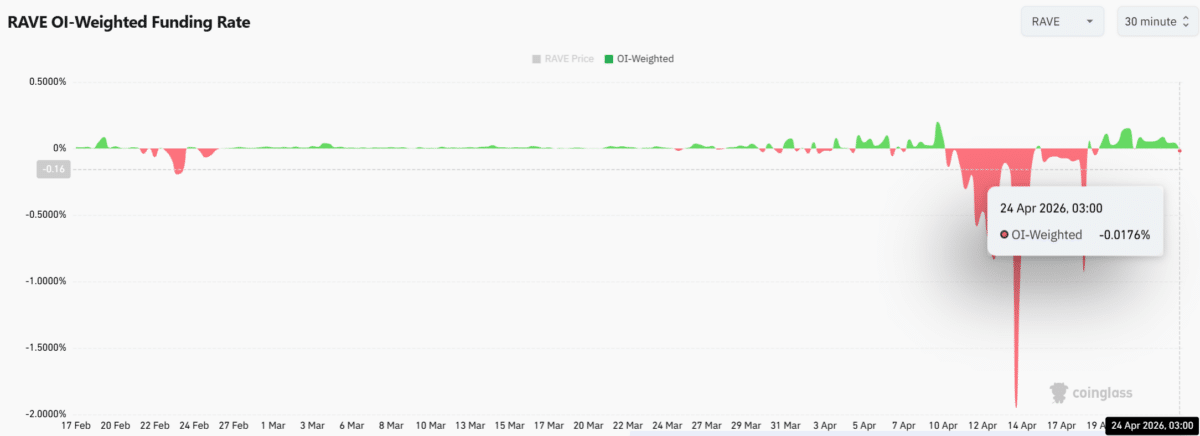
The OI-Weighted Funding Rate turned negative, reaching -0.0176%, signaling that short traders paid fees.
This shift occurred even as top traders leaned heavily toward long positions. The divergence highlighted tension between sentiment and derivatives positioning.
While traders expressed bullish bias, the funding structure reflected underlying pressure.
Negative funding often emerges when short demand increases or long conviction weakens. In this case, it suggested that the market did not fully align with the visible long positioning.
As a result, this imbalance pointed to potential instability beneath the surface, especially if price fails to hold its current range.
 Source: CoinGlass
Conclusively, $RAVE’s rally showed strength on the surface, yet weakening volume and structural resistance limited conviction.
Heavy long positioning added risk, while negative funding exposed underlying tension. If these divergences persist, price could struggle to sustain gains and remain confined within its current range.
Final Summary
- $RAVE surged despite falling volume, suggesting weak participation behind the price increase.
- Heavy long positioning and negative funding reveal an imbalance that could pressure price stability.





