Bitget App
Trade smarter
Buy cryptoMarketsTradeFuturesEarnAISquareMore
Injective (INJ) Price Eyes Breakout as Mainnet Upgrade Gains Momentum

Injective (INJ) Price Eyes Breakout as Mainnet Upgrade Gains Momentum

CoinpediaCoinpedia2026/04/28 09:45
By:Coinpedia
Story Highlights
  • Injective mainnet upgrade introduces performance boost and INJ buyback model.

  • Breakout narrative builds as analysts and structure align near $4 resistance.

Injective (INJ) price is showing early signs of stabilization after a prolonged downtrend, with selling pressure beginning to ease near key support levels. While the broader structure remains cautious, recent price action suggests the market is attempting to build a base rather than extend losses.

This comes as Injective moves closer to a scheduled mainnet upgrade, a catalyst that could influence both network performance and token demand. With price compressing near resistance and sentiment gradually improving, INJ is now approaching a decisive phase.

Injective Mainnet Upgrade: Utility Improves, Buyback Adds Demand Layer

Injective’s approved mainnet upgrade, expected around April 28, brings both technical improvements and a shift in token economics.

The upgrade focuses on improving execution efficiency and optimizing on-chain modules, making the network more reliable for DeFi and trading use cases. Alongside this, the introduction of INJ token buybacks creates a direct demand mechanism tied to protocol activity. This adds a structural support layer for the token, but price action indicates the market is still waiting for confirmation rather than pricing it aggressively.

INJ Price Analysis: Compression Builds Below $4 Breakout Level

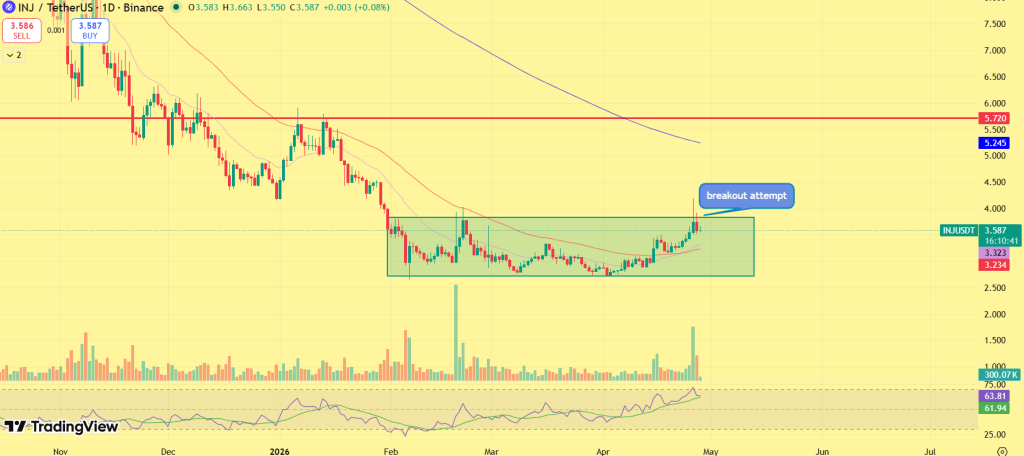
INJ price has moved out of a clear downtrend into a base formation, holding steady in the $3.20–$3.40 demand zone where selling pressure has faded.
Injective (INJ) Price Eyes Breakout as Mainnet Upgrade Gains Momentum image 0

Since then, INJ price has been consolidating within a tightening range, forming higher lows while approaching resistance near $3.80–$4.00. This reflects a compression structure, where momentum builds before a potential directional move.

Analyst commentary aligns with this setup, pointing toward a possible breakout as the descending trend weakens. However, confirmation remains key. Currently trading around $3.5–$3.6, INJ is testing this resistance with improving momentum. RSI is pushing toward 60, and volume is gradually expanding, both early signs of strengthening buyer interest.

A sustained move above $4.00 would confirm a breakout and open upside toward $5.20–$5.70. On the downside, $3.20 remains the critical support that holds the current structure intact.

Final Words

INJ remains in a transition phase, with structure improving but confirmation still pending. A sustained move above $4 would shift momentum decisively in favor of buyers, while failure to break could extend the current range. For now, the setup leans constructive, but the breakout is what validates it.


0
0

Disclaimer: The content of this article solely reflects the author's opinion and does not represent the platform in any capacity. This article is not intended to serve as a reference for making investment decisions.

Understand the market, then trade.
Bitget offers one-stop trading for cryptocurrencies, stocks, and gold.
Trade now!

You may also like

VIPTradFi Focus: Where Does the RWA Market Stand Today?

1. Crypto outperformed traditional equity indexes following the rate hike, but elevated interest rates remain a key constraint on cross-asset allocation. From September 12 to 18, BTC, ETH, and SOL gained 4.83%, 3.84%, and 9.96%, respectively, while the S&P 500 edged down 0.08%. The U.S. Dollar Index rose 1.11%, and the 10-year U.S. Treasury yield closed at approximately 4.998%. Improving risk appetite is therefore coexisting with elevated discount rates, raising the bar for RWA allocation: investors need to compare not only returns on the underlying assets, but also on-chain liquidity and collateral efficiency. 2. Growth in tokenized equities is occurring even as the overall RWA market remains under pressure. As of September 18, Distributed Asset Value across RWAs stood at $38.503 billion, down 1.13% week over week, while tokenized equities reached $3.056 billion, up 6.03%. This week's data are better explained by capital reallocating across different RWA segments than by a broad-based expansion of the entire RWA market. 3. For exchanges, the opportunity lies in connecting spot holdings, collateral, and derivatives. Reality's distributed asset value stands at approximately $155 million, while eligible rTokens can already be used within Bitget's UTA margin framework. Across CoinGlass's verifiable sample of 177 TradFi instruments, open interest reached approximately $11.498 billion, up 2.06% week over week, even as weekly trading volume declined 7.60%. The medium-term opportunity remains intact, but deeper utilization will depend on liquidity, collateral use, and sustained trading activity. 4.Assets to watch: BTC, ETH, SOL, NEAR, ZEC, gold, tokenized U.S. equities, COST. 5.Key metrics to watch: rToken collateral utilization, the durability of TradFi open interest and trading volume, and next week's employment and consumer data.

Bitget2026/09/21 06:38
TradFi Focus: Where Does the RWA Market Stand Today?
