Bitget App
Trade smarter
Buy cryptoMarketsTradeFuturesEarnAISquareMore
Monero rises 30% in a month: Charting XMR’s path to $799 ATH

Monero rises 30% in a month: Charting XMR’s path to $799 ATH

CryptoNewsNetCryptoNewsNet2026/05/05 21:51
By:CryptoNewsNet
Back to the list

Monero rises 30% in a month: Charting XMR’s path to $799 ATH

Monero rises 30% in a month: Charting XMR’s path to $799 ATH image 0  ambcrypto.com 17 m
Monero rises 30% in a month: Charting XMR’s path to $799 ATH image 1

Is the privacy narrative gathering steam once more? Monero [$XMR] has rallied 30.51% since setting a local low at $313.32 on Friday, the 3rd of April.

Interestingly, ZCash [$ZEC] and Dash [$DASH], the popular privacy tokens, have rallied 30% within the past week, according to CoinMarketCap.

Like ZCash, Monero saw a blow-off top in recent months and saw a deep retracement in February. Both privacy tokens have broken local highs and were on their way toward recovery.

Some traders held the idea that the $ZEC and $DASH gains of the past week would soon be rotated into $XMR, leading to a more aggressive price surge. For now, traders should resist FOMO, but a buying opportunity seems to be at hand.

The end of Monero’s retracement
Monero rises 30% in a month: Charting XMR’s path to $799 ATH image 2 Source: $XMR/USD on TradingView

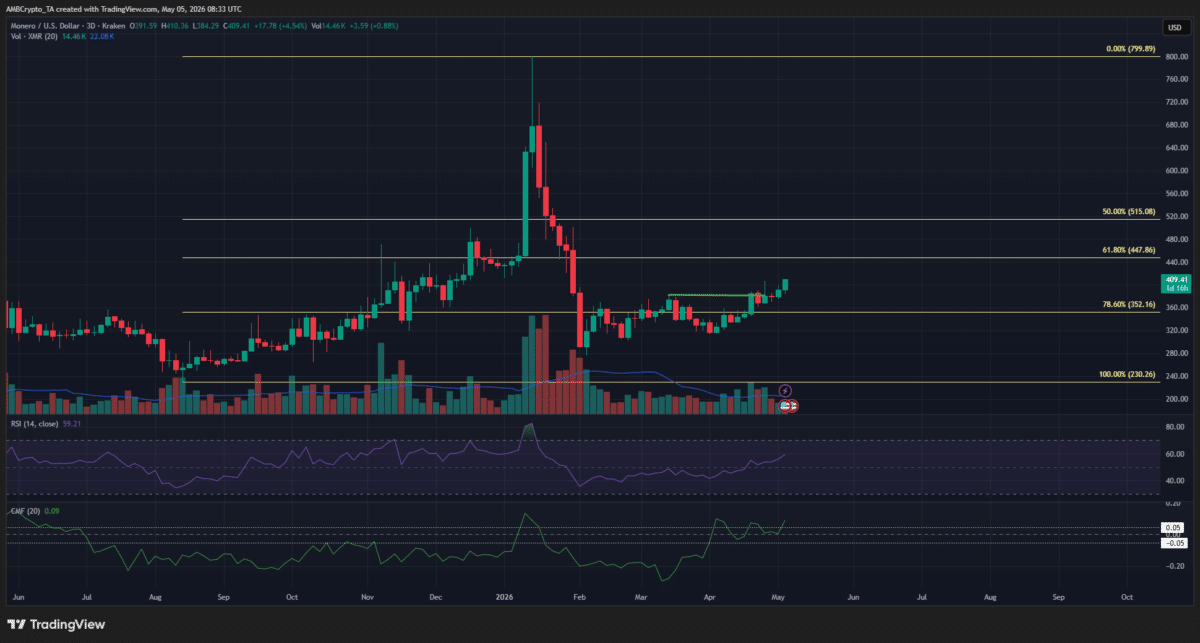
After falling below the 78.6% Fibonacci retracement level during the February crash, Monero has done well to climb higher. The bullish momentum for Bitcoin [$BTC], accompanied by market disbelief and profit-taking, has likely buoyed the altcoin’s sentiment too.

In terms of magnitude, the Monero rally has been on par with the $BTC’s since February. However, the higher timeframe swing structure for the privacy coin was bullish, while it was bearish for the market leader.

The breach of the local high (green) at $382.12 on Tuesday, the 21st of April, was a positive sign for the bulls. Towards the end of April, the buyers had flipped this level to support and kept the current move going higher.

The RSI on the 3-day chart was about to climb past 60 to signal strong upward momentum, and the CMF was at +0.09 to indicate steady capital inflows.

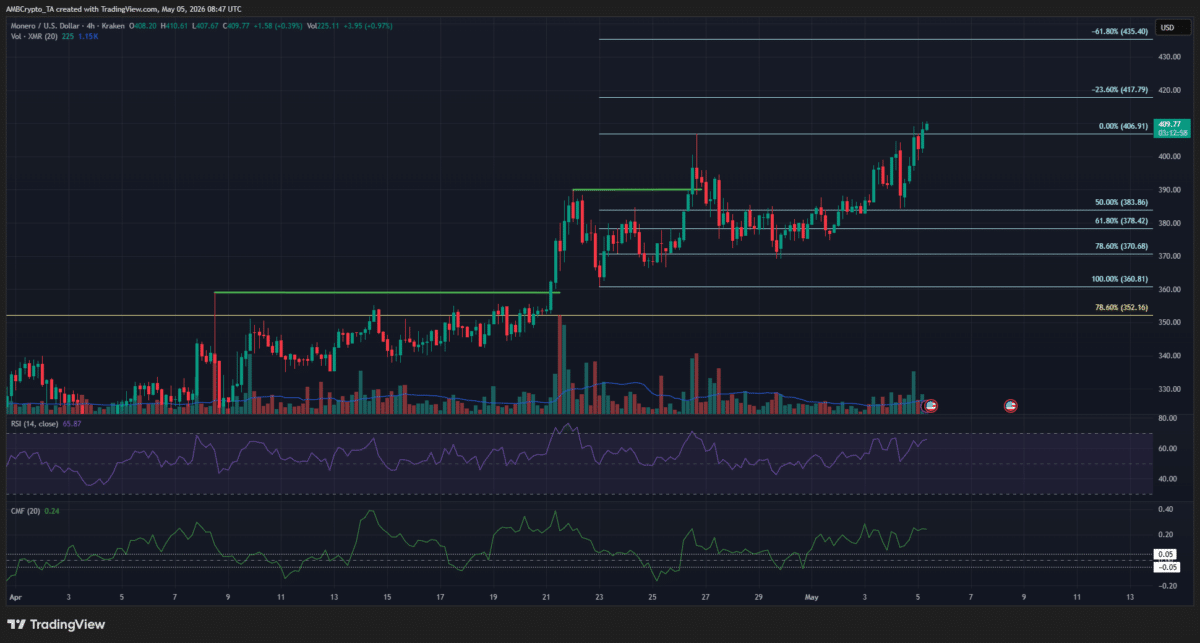
Here’s why the rally could extend another 6%
Monero rises 30% in a month: Charting XMR’s path to $799 ATH image 3 Source: $XMR/USD on TradingView

The H4 bullish structure breaks are marked in green. Using the Fibonacci levels once again for the latest bullish move, the $417 and $435 were plotted as the next $XMR short-term price targets.

In the coming weeks and months, the privacy coin can go to $500 and even the $799 all-time high if there is sustained demand and a narrative boost later in 2026.

Final Summary

  • Monero has a bullish structure across different timeframes, and the rally is likely to extend higher.
  • In the short term, traders can expect the bullish move to reach $435.
0
0

Disclaimer: The content of this article solely reflects the author's opinion and does not represent the platform in any capacity. This article is not intended to serve as a reference for making investment decisions.

Understand the market, then trade.
Bitget offers one-stop trading for cryptocurrencies, stocks, and gold.
Trade now!

You may also like

VIPTradFi Focus: Where Does the RWA Market Stand Today?

1. Crypto outperformed traditional equity indexes following the rate hike, but elevated interest rates remain a key constraint on cross-asset allocation. From September 12 to 18, BTC, ETH, and SOL gained 4.83%, 3.84%, and 9.96%, respectively, while the S&P 500 edged down 0.08%. The U.S. Dollar Index rose 1.11%, and the 10-year U.S. Treasury yield closed at approximately 4.998%. Improving risk appetite is therefore coexisting with elevated discount rates, raising the bar for RWA allocation: investors need to compare not only returns on the underlying assets, but also on-chain liquidity and collateral efficiency. 2. Growth in tokenized equities is occurring even as the overall RWA market remains under pressure. As of September 18, Distributed Asset Value across RWAs stood at $38.503 billion, down 1.13% week over week, while tokenized equities reached $3.056 billion, up 6.03%. This week's data are better explained by capital reallocating across different RWA segments than by a broad-based expansion of the entire RWA market. 3. For exchanges, the opportunity lies in connecting spot holdings, collateral, and derivatives. Reality's distributed asset value stands at approximately $155 million, while eligible rTokens can already be used within Bitget's UTA margin framework. Across CoinGlass's verifiable sample of 177 TradFi instruments, open interest reached approximately $11.498 billion, up 2.06% week over week, even as weekly trading volume declined 7.60%. The medium-term opportunity remains intact, but deeper utilization will depend on liquidity, collateral use, and sustained trading activity. 4.Assets to watch: BTC, ETH, SOL, NEAR, ZEC, gold, tokenized U.S. equities, COST. 5.Key metrics to watch: rToken collateral utilization, the durability of TradFi open interest and trading volume, and next week's employment and consumer data.

Bitget2026/09/21 06:38
TradFi Focus: Where Does the RWA Market Stand Today?