
Bitget App
Trade smarter
Buy cryptoMarketsTradeFuturesEarnAISquareMore
Is HYPE entering a bear market after a 10% weekly decline?

Is HYPE entering a bear market after a 10% weekly decline?

CryptoNewsNetCryptoNewsNet2026/05/14 11:21
By:CryptoNewsNet
Back to the list

Is HYPE entering a bear market after a 10% weekly decline?

Is HYPE entering a bear market after a 10% weekly decline? image 0  18 m
Is HYPE entering a bear market after a 10% weekly decline? image 1
The cryptocurrency market has flipped bearish as long traders recorded massive losses over the past 24 hours.

Bitcoin has dropped below $80,000 once again, while Ethereum failed to defend the $2,300 resistance level.

$HYPE, the native coin of the Hyperliquid DEX, is down by 3.6%, making it the second-worst performer among the top 10 cryptocurrencies by market cap.

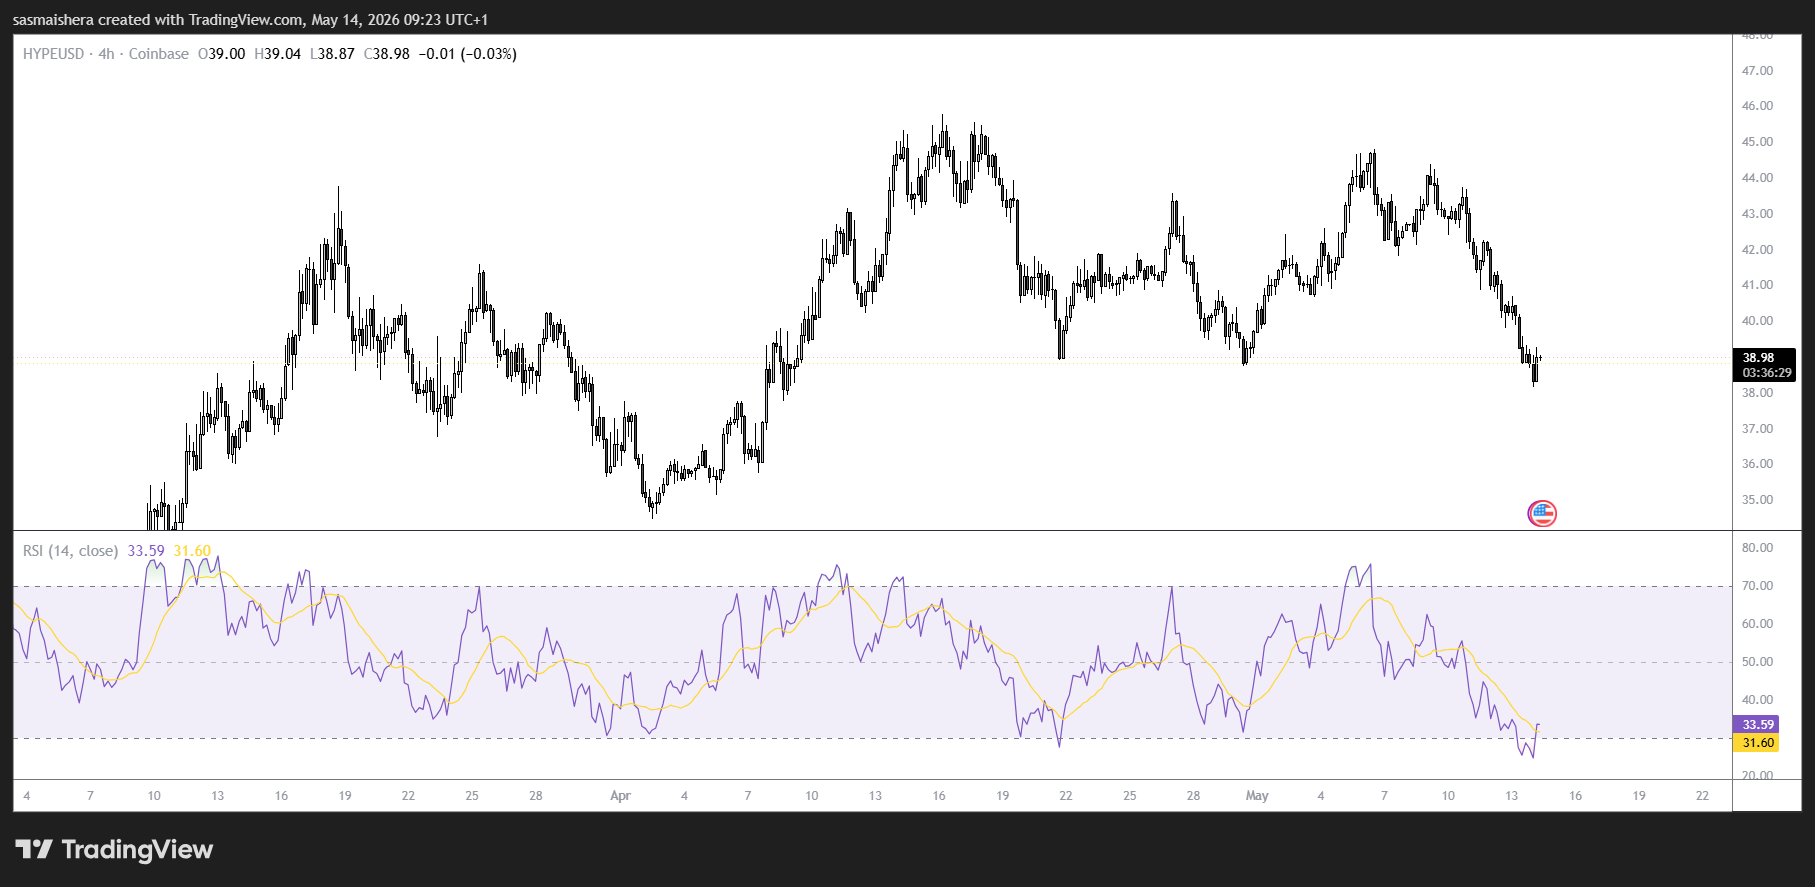
It is currently trading at $38 after closing below the rising trendline earlier this week. Mixed signals from the derivatives markets put a lid on $HYPE’s recovery.

If the bearish trend persists, $HYPE could likely aim for the support level around $37 in the near term.

Mixed sentiment keeps $HYPE bearish

$HYPE has been underperforming over the past few days, losing 10% of its value in the last seven days.

The bearish performance comes amid mixed sentiment from retail investors. Data obtained from CoinGlass shows mixed signals, keeping the bulls cautious.

The long-to-short ratio for $HYPE reads 0.70 on Thursday, the lowest level over a month.

This ratio, being below one, reflects bearish sentiment in the market, as more traders are betting on the asset’s price to fall.

However, the funding rates support a positive sentiment among traders.

CoinGlass’ OI-Weighted Funding Rate data for $HYPE flipped positive on Wednesday and reads 0.0078% on Thursday.

This metric being positive indicates that longs are paying shorts, projecting a bullish sentiment.

The combination of these two derivative metrics suggests indecision among $HYPE investors and a lack of clear directional bias.

This could keep $HYPE low, affecting its chances of a sustained recovery.

Hyperliquid price forecast

Similar to other leading cryptocurrencies, the $HYPE/USD 4-hour chart is bearish thanks to its recent poor performance.

$HYPE’s price broke and closed below the rising trendline earlier this week, losing 7% of its value in the last two days.

At the time of writing on Thursday, $HYPE is extending the correction, trading below $39.

If the bearish trend continues, the bears could push the price below the 200-day Exponential Moving Average (EMA) at $37.88.

A daily candle close below the 200-day EMA would pave the way for a deeper correction towards the $36.09 support level in the near term.

Currently, Hyperliquid’s momentum indicators suggest a bearish outlook. The Relative Strength Index (RSI) on the 4-hour chart reads 33, approaching the oversold region.

Meanwhile, Moving Average Convergence Divergence (MACD) indicators on the same chart showed a bearish crossover on Monday, projecting a negative outlook.

However, if the bulls regain control of the market, $HYPE could extend its recovery toward the 50-day EMA at $40.11.
Is HYPE entering a bear market after a 10% weekly decline? image 2

A daily candle close above this level would allow the bulls to target the recent 4-hour swing high at $42.25.

However, the broader market conditions remain bearish, which could affect recovery for $HYPE and other leading cryptocurrencies in the near term.


0
0

Disclaimer: The content of this article solely reflects the author's opinion and does not represent the platform in any capacity. This article is not intended to serve as a reference for making investment decisions.

Understand the market, then trade.
Bitget offers one-stop trading for cryptocurrencies, stocks, and gold.
Trade now!

You may also like

VIPTradFi Focus: Where Does the RWA Market Stand Today?

1. Crypto outperformed traditional equity indexes following the rate hike, but elevated interest rates remain a key constraint on cross-asset allocation. From September 12 to 18, BTC, ETH, and SOL gained 4.83%, 3.84%, and 9.96%, respectively, while the S&P 500 edged down 0.08%. The U.S. Dollar Index rose 1.11%, and the 10-year U.S. Treasury yield closed at approximately 4.998%. Improving risk appetite is therefore coexisting with elevated discount rates, raising the bar for RWA allocation: investors need to compare not only returns on the underlying assets, but also on-chain liquidity and collateral efficiency. 2. Growth in tokenized equities is occurring even as the overall RWA market remains under pressure. As of September 18, Distributed Asset Value across RWAs stood at $38.503 billion, down 1.13% week over week, while tokenized equities reached $3.056 billion, up 6.03%. This week's data are better explained by capital reallocating across different RWA segments than by a broad-based expansion of the entire RWA market. 3. For exchanges, the opportunity lies in connecting spot holdings, collateral, and derivatives. Reality's distributed asset value stands at approximately $155 million, while eligible rTokens can already be used within Bitget's UTA margin framework. Across CoinGlass's verifiable sample of 177 TradFi instruments, open interest reached approximately $11.498 billion, up 2.06% week over week, even as weekly trading volume declined 7.60%. The medium-term opportunity remains intact, but deeper utilization will depend on liquidity, collateral use, and sustained trading activity. 4.Assets to watch: BTC, ETH, SOL, NEAR, ZEC, gold, tokenized U.S. equities, COST. 5.Key metrics to watch: rToken collateral utilization, the durability of TradFi open interest and trading volume, and next week's employment and consumer data.

Bitget2026/09/21 06:38
TradFi Focus: Where Does the RWA Market Stand Today?
