
Ethereum Price Stabilizes After Selloff, But Bears Still Hold Advantage

Ethereum price started a fresh decline and traded below $2,120. ETH is now consolidating above $2,050 and might struggle to recover.
- Ethereum remained in a bearish zone after a sharp decline.
- The price is trading below $2,165 and the 100-hourly Simple Moving Average.
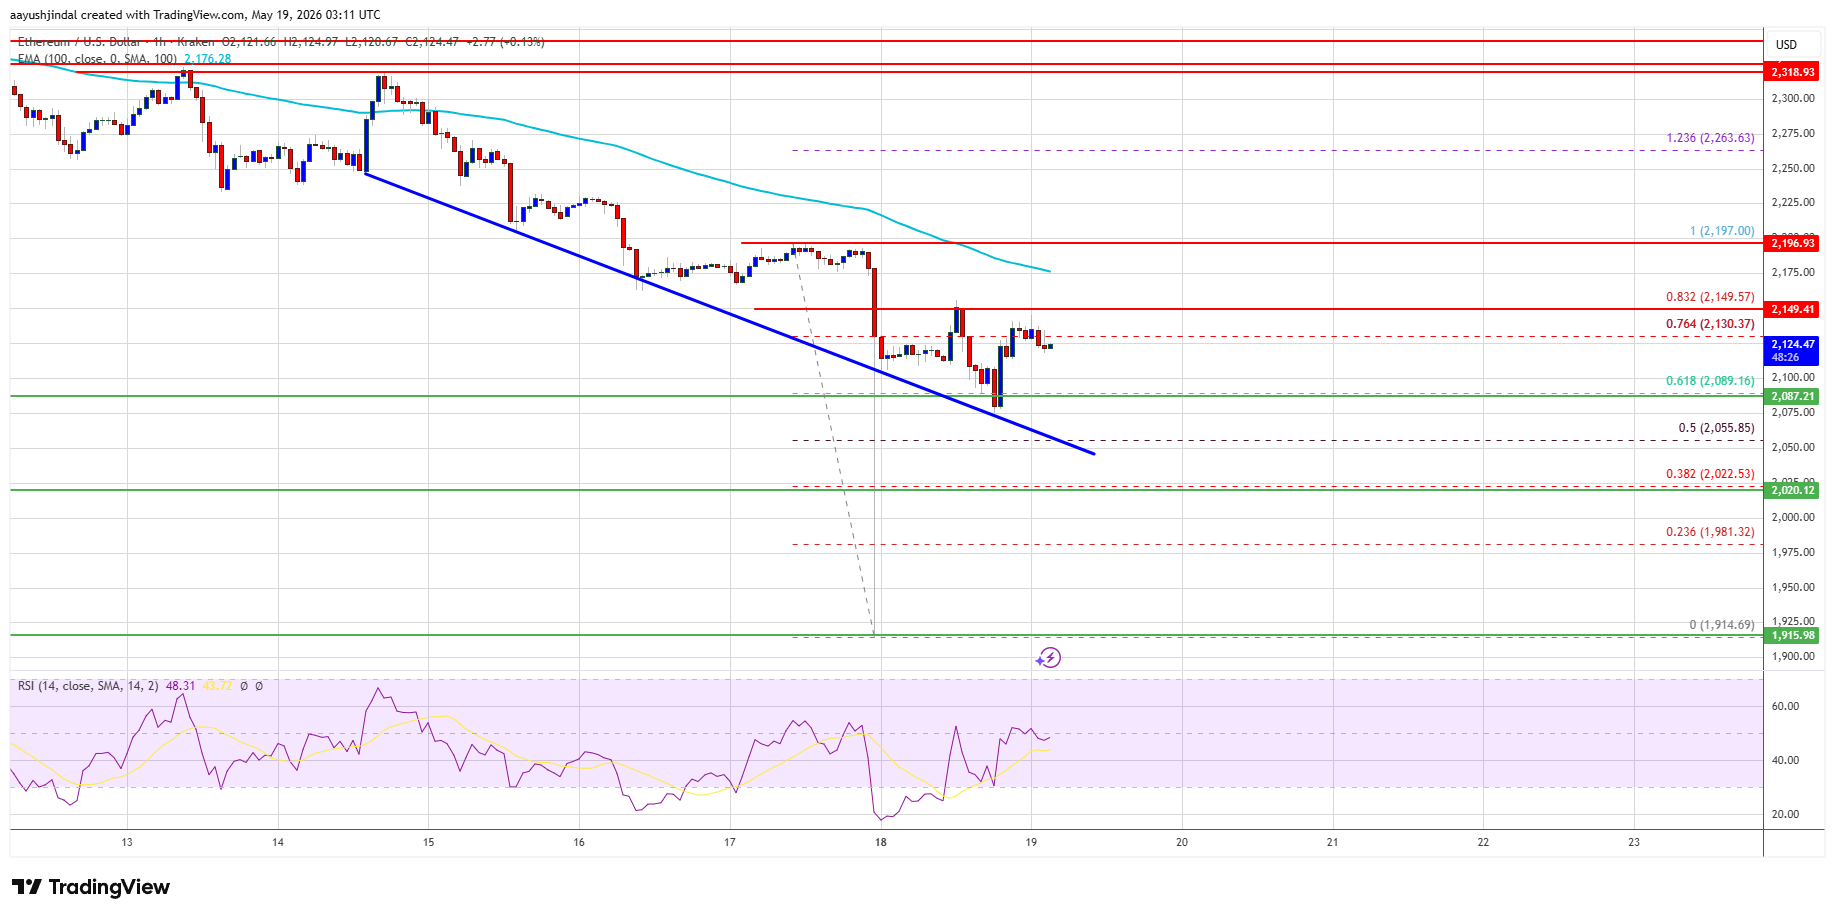
- There is a connecting trend line forming with support at $2,020 on the hourly chart of ETH/USD (data feed via Kraken).
- The pair could continue to move down if it stays below the $2,200 zone.
Ethereum Price Consolidates Losses
Ethereum price failed to remain stable above $2,200 and started a downside correction, like Bitcoin. ETH price dipped below the $2,165 and $2,150 levels.
The price even traded below $2,020. A low was formed at $1,914 on Kraken, and the price is now attempting to recover most losses. There was a recovery wave above the 61.8% Fib retracement level of the downward move from the $2,198 swing high to the $1,914 low.
Ethereum price is now trading below $2,165 and the 100-hourly Simple Moving Average. Besides, there is a connecting trend line forming with support at $2,020 on the hourly chart of ETH/USD.
If the bulls remain in action above $2,020, the price could attempt another increase. Immediate resistance is seen near the $2,150 level or the 83.2% Fib retracement level of the downward move from the $2,198 swing high to the $1,914 low. The first key resistance is near the $2,175 level.
 Source:
The next major resistance is near the $2,200 level. A clear move above the $2,200 resistance might send the price toward the $2,250 resistance. An upside break above the $2,250 region might call for more gains in the coming days. In the stated case, Ether could rise toward the $2,320 resistance zone or even $2,350 in the near term.
Another Drop In ETH?
If Ethereum fails to clear the $2,150 resistance, it could start a fresh decline. Initial support on the downside is near the $2,090 level. The first major support sits near the $2,050 zone.
A clear move below the $2,050 support might push the price toward the $2,020 support. Any more losses might send the price toward the $1,940 region. The main support could be $1,920.
Technical Indicators
Hourly MACD – The MACD for ETH/USD is losing momentum in the bearish zone.
Hourly RSI – The RSI for ETH/USD is now above the 50 zone.
Major Support Level – $2,020
Major Resistance Level – $2,190
Disclaimer: The content of this article solely reflects the author's opinion and does not represent the platform in any capacity. This article is not intended to serve as a reference for making investment decisions.
You may also like
Gold prices fall Rs 1,331/10 gram, silver dips Rs 1,600/kg as Mideast tensions outweigh oil fall: Key levels to track
Strategists Say Market's ‘Wall of Worry' Is Healthy, Not a Warning Sign

Canadian Dollar seems vulnerable near August 7 low amid sliding oil prices, trade tensions
Houthis claim attacks on Saudi capital, thick smoke seen near Riyadh airport
Crypto prices
More


