


Solana is still moving inside a tight range, with $81.30 now acting as the next short-term support level. However, the weekly chart shows a weaker setup, as one analyst points to a possible drop toward $30 if $SOL loses its current range.
Solana Price Stays Range-Bound as $81.30 Support Comes Into Focus
Solana remains stuck in a sideways range on the 4-hour chart shared by More Crypto Online on X, while short-term pressure still points lower.
The $SOL/USD chart shows price trading near $84.44 after failing to hold the recent move toward the $96 resistance area. That rejection pushed $SOL back into the middle of its range.
More Crypto Online said there is still no clear sign that a local low has formed. Because of that, the next support level sits near $81.30.
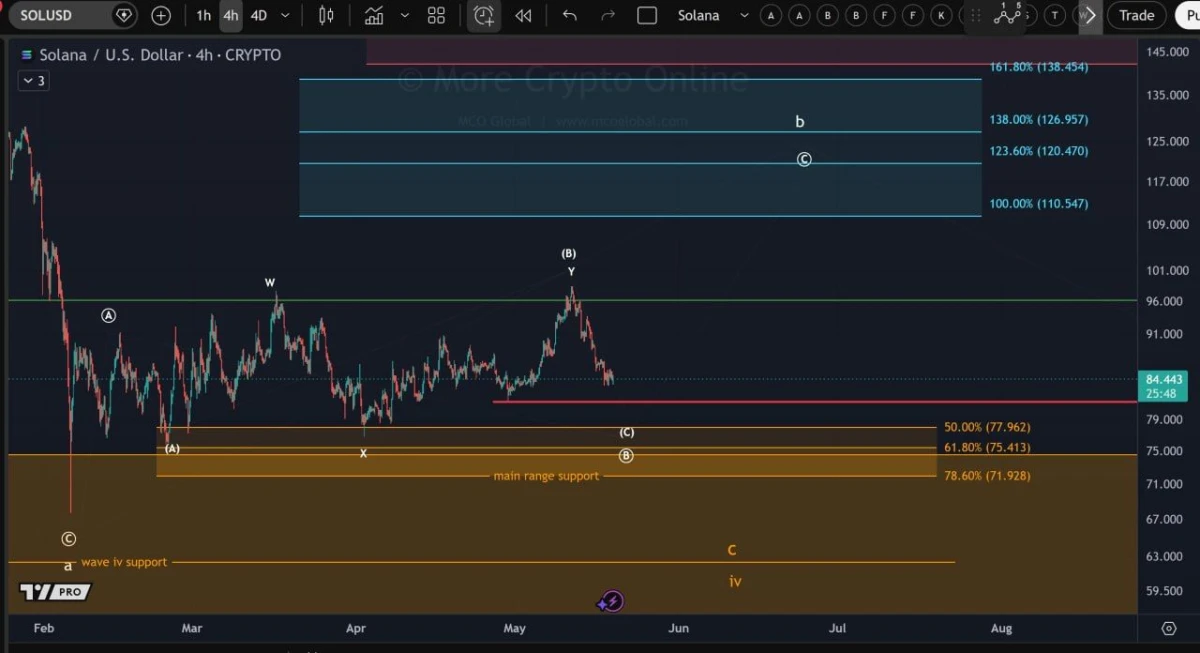
$SOL/USD 4-Hour Price Chart. Source: More Crypto Online on X
The chart also marks the main range support between the Fibonacci levels at $77.96, $75.41, and $71.92. This zone remains important if $SOL loses the current short-term support.
On the upside, Solana needs to reclaim the $96 area first. A stronger move above that level could restart the C-wave setup shown on the chart.
The higher target zone starts near $110.55 and extends toward $120.47, $126.96, and $138.45. However, those levels only matter if buyers regain control.
For now, Solana has not confirmed a bullish reversal. The chart shows sideways price action, short-term weakness, and a key support test near $81.30.
Solana Price Faces $30 Risk as Weekly Chart Points Lower
Solana price is showing a weaker long-term setup on the weekly chart shared by Justin Bennett on X, with the analyst pointing to a possible move back toward $30.
The $SOL/$USDT weekly chart shows Solana trading near $84 after a long decline from the 2025 high area. Price has moved sideways for several weeks, but the structure still sits below the previous breakdown zone.
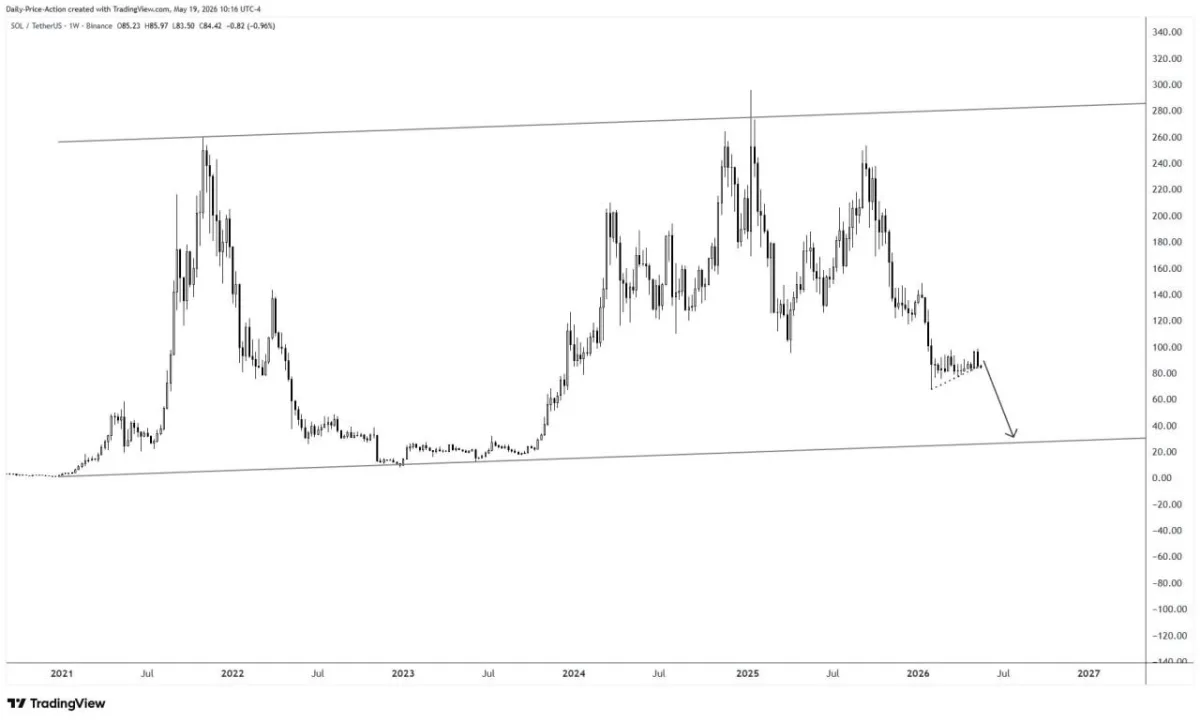
$SOL/$USDT Weekly Price Chart. Source: Justin Bennett on X
The chart also shows $SOL inside a large rising channel that has guided price action since 2021. The upper trendline rejected price several times during major rallies, while the lower trendline sits much lower, near the $30 area.
Bennett’s chart marks a possible drop from the current consolidation range toward that lower channel support. This means the analyst sees the recent sideways move as a pause before another leg down.
The key issue is that $SOL has not reclaimed the higher resistance zones near $120 to $140. Without that recovery, the weekly trend still looks pressured.
However, the $30 target depends on $SOL losing its current range and continuing toward the lower channel line. If buyers defend the current area and reclaim resistance, the bearish path would weaken.
For now, the chart shows downside risk rather than a confirmed move. Solana remains under pressure, and the lower channel support near $30 is the main bearish target.


