thecryptobasic.com
Crypto analyst GainMuse suggests that Shiba Inu is approaching a decisive technical level after forming a tightly compressed structure on the 2-hour timeframe.
GainMuse’s analysis indicates that Shiba Inu is entering a high-pressure zone where the market could determine its next major direction.
Key Points
- Crypto analyst GainMuse believes Shiba Inu is approaching a pivotal technical level on the 2-hour timeframe.
- $SHIB could slide toward $0.0000052 if sellers continue rejecting bullish recovery attempts.
- Despite the bearish pressure, bulls still have a chance to reclaim momentum and defend the current structure.
- Another analyst projects that $SHIB may be preparing for a fresh rally, with an upside target of $0.000008.
Shiba Inu Forms Clean Decision Setup: Analyst
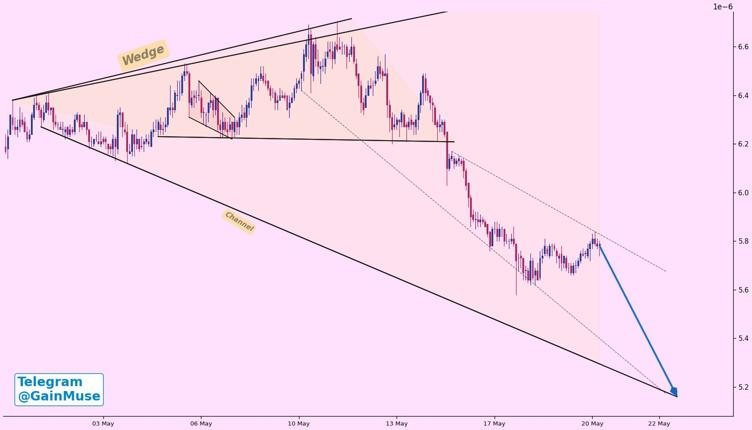
According to GainMuse, Shiba Inu’s two-hour chart features 14 active levels, including nine support zones and five resistance levels. As a result, the structure forms what the analyst described as a “clean decision setup.”
Furthermore, GainMuse explained that the large number of active pivots shows $SHIB trading within a genuine pressure area. The analyst also identified two major formations on the chart, featuring a wedge pattern and a broader descending channel.
Initially, $SHIB traded within the wedge before eventually losing support and sliding lower into the descending channel below the $0.000006 range.
Next Moves?
Notably, the chart shows $SHIB approaching another critical reaction zone near the lower boundary of the descending channel. Meanwhile, the chart’s projected path suggests Shiba Inu could decline further to $0.0000052 if sellers continue rejecting recovery attempts.
However, GainMuse emphasized that buyers still have an opportunity to regain control. If bulls defend the current support region and successfully break above nearby resistance levels, $SHIB could quickly shift into a stronger momentum phase.
For now, traders are closely watching the next interaction between support and resistance, as it could determine whether $SHIB stages a recovery or extends its ongoing downtrend.
Analyst Says $SHIB Is Gearing Up for ‘Round 2’
In the meantime, Shiba Inu continues to trade below $0.000006 while mirroring the broader market’s bearish performance. At the current price of $0.000005839, $SHIB has fallen 8.42% over the past month and 6.93% in the last seven days, although it has gained a modest 0.39% in the past 24 hours.
Notably, the bullish momentum seen earlier this month has faded. $SHIB previously rallied strongly and appears poised to revisit the $0.000007 level. However, after climbing to $0.0000067 on May 11, the token reversed course and dropped back below $0.000006.
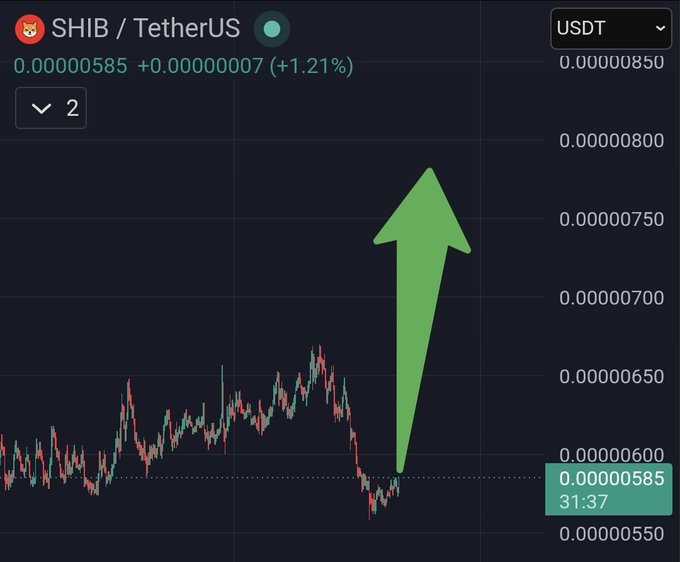
Meanwhile, popular analyst $SHIB KNIGHT remains optimistic about a rebound. According to the analyst, $SHIB is preparing for “round two” of its recent rally, with a projected move toward $0.0000080.
If achieved, that target would represent a roughly 37% increase from current levels. Nevertheless, uncertainty still surrounds the possibility of another major short-term rally for $SHIB.