Bitget App
Trade smarter
Buy cryptoMarketsTradeFuturesStocksEarnInstitutionAI & More
Humanity Protocol token sheds 13% in a day to challenge local support zone: What’s next?

Humanity Protocol token sheds 13% in a day to challenge local support zone: What’s next?

CryptoNewsNetCryptoNewsNet2026/05/23 09:18
By:CryptoNewsNet
Back to the list

Humanity Protocol token sheds 13% in a day to challenge local support zone: What’s next?

Humanity Protocol token sheds 13% in a day to challenge local support zone: What’s next? image 0  ambcrypto.com 36 m
Humanity Protocol token sheds 13% in a day to challenge local support zone: What’s next? image 1

In April, AMBCrypto pointed out that the Humanity Protocol’s [H] higher timeframe bias remained bullish. The altcoin has made a series of higher lows since September 2025, and the previous week’s losses of nearly 11% were not enough to undo.
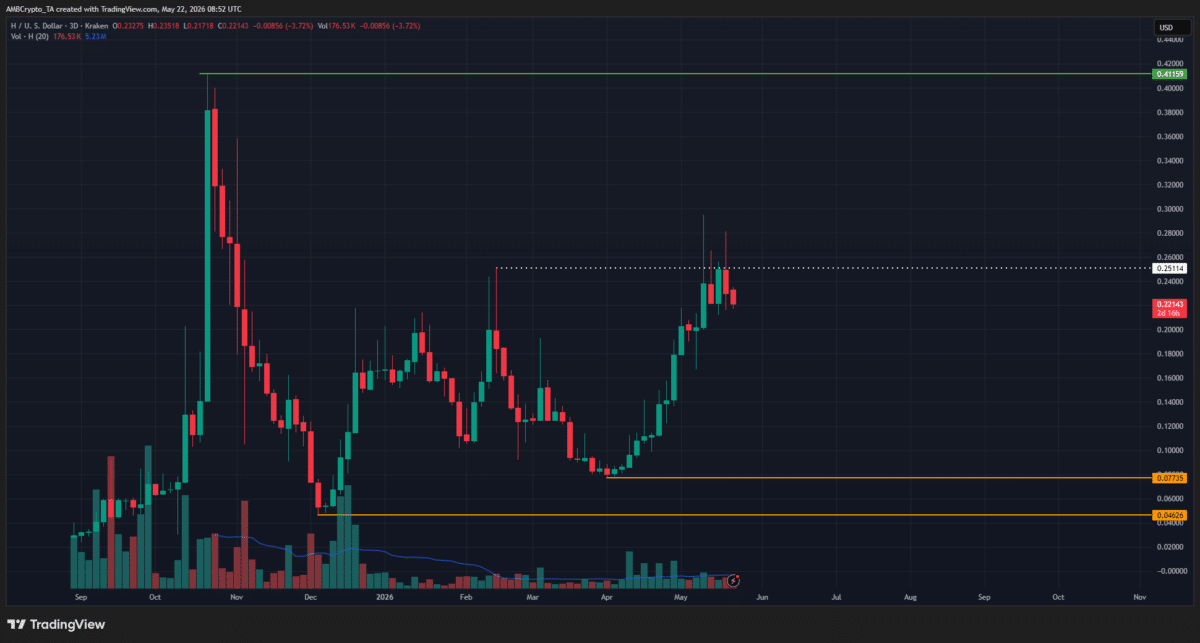
Humanity Protocol token sheds 13% in a day to challenge local support zone: What’s next? image 2 Source: H/USD on TradingView

The higher low at $0.046 kept the long-term uptrend alive. Meanwhile, $0.77 and $0.251 were the key horizontal levels that could decide the direction of the next swing move.

The latter, which marked a high in February, was tested multiple times in May. The bears have refused to budge and, in the previous week of trading, managed to push the buyers backward.

The recent rejection showcased the strength of the sellers at the local resistance zone. Is it enough to bring about a deeper correction, or is it only a matter of time before the Humanity bulls succeed?

The range formation and the H retracement potential
Humanity Protocol token sheds 13% in a day to challenge local support zone: What’s next? image 3 Source: H/USD on TradingView

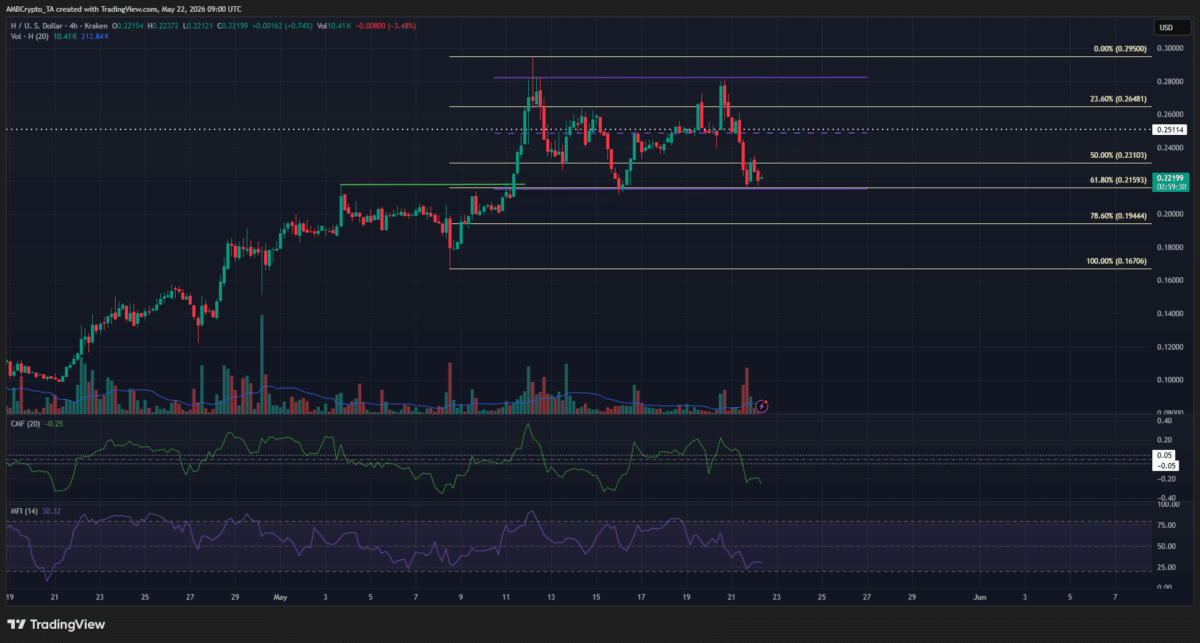
Can an asset be both rangebound and in a retracement phase? The 4-hour chart of Humanity Protocol showed how this is possible. A structural break (green) earlier in May set up a bullish swing move.

Using this rally from $0.167 to $0.295, a set of Fibonacci retracement levels was plotted. H has retraced to $0.215, the 61.8% retracement level, twice in the past ten days.

The second retest of the same support zone could yield a bullish reaction, since H also appeared to be trading within a range in recent days.

Traders should be cautious of buying at the $0.215 local lows. The CMF was well below the -0.05 threshold, showing hefty capital outflows and intense selling.

The MFI agreed with this finding, indicating both selling pressure and downward momentum with a reading of 30.3.

Despite the short-term range formation, a deeper retracement to $0.194 or even the $0.167 swing low on the 4-hour chart was possible. Traders can maintain a bullish bias but also be prepared for the possibility that the $0.215 support might not hold.

Final Summary

  • Humanity Protocol shed 13.2% in the past 24 hours after its rejection at the $0.28 local range highs recently.
  • The higher timeframe trend was bullish. Swing traders can remain confident of a continued uptrend so long as the $0.167 low is defended.

0
0

Disclaimer: The content of this article solely reflects the author's opinion and does not represent the platform in any capacity. This article is not intended to serve as a reference for making investment decisions.

Understand the market, then trade.
Bitget offers one-stop trading for cryptocurrencies, stocks, and gold.
Trade now!

You may also like

Long-term US Treasury Sell-off Continues! 10-Year Treasury Yield Breaks 5.2% Again, “AI Boom vs. Rising Financing Costs” Narrative Showdown Intensifies

On Monday, oil prices rose and US Treasury bonds were sold off again as former US President Donald Trump rejected Iran's latest proposal to reopen the Strait of Hormuz, heightening concerns about inflation.

智通财经•2026/09/28 03:16

Banks Have Been Earning Effortlessly from Idle Funds for Years—Will AI Agents Change Everything?

For years, banks have profited from customers' idle funds, but AI agents may be about to change this situation.

智通财经•2026/09/28 03:11

Goldman Sachs: US stocks are showing a "strong index, weak confidence" pattern; catch-up rally may become the main theme of the next phase

Goldman Sachs stated that the current U.S. stock market is showing an unusual pattern: while index performance is strong, investor confidence remains weak. This suggests that the market still has further upside potential, and stocks that previously lagged behind leading AI stocks may soon experience a catch-up rally.

智通财经•2026/09/28 03:06
Goldman Sachs: US stocks are showing a "strong index, weak confidence" pattern; catch-up rally may become the main theme of the next phase