
Bitcoin’s April recovery showed signs of structural accumulation

April 2026 will be remembered not for explosive gains but for structural repair. After a brutal February and March, marked by sharp drawdowns, leverage flushes, and sentiment washouts that left Bitcoin grinding below $70,000, the market staged a methodical recovery that closed the month near $76,300, representing an approximate 11–12% gain.
- Bitcoin price recovered more than 11% in April as institutional inflows and spot demand returned across major exchanges.
- ETF inflows, corporate Bitcoin purchases, and improving on-chain data supported the market’s recovery after the February and March selloff.
- Bitcoin’s April rebound reflected a structural recovery phase rather than a leverage-driven short squeeze.
That figure understates what actually happened beneath the surface. The recovery was architectural: higher lows replaced lower lows, positive cumulative volume delta (CVD) persisted across all major exchanges simultaneously for the first time since July 2025, and genuine altcoin rotation began to materialize. This was not a short squeeze. It was a climb built on institutional conviction and improving market structure.
Macro and geopolitics: the Strait of Hormuz as the central risk Toggle
Every meaningful price move in April traced back to a single 33-kilometer waterway. The U.S.–Iran conflict and its grip on the Strait of Hormuz functioned as the dominant on/off switch for global risk appetite, with Bitcoin (BTC) responding in near real-time to each development.
The month opened in a standoff. Iran had submitted a ten-point counteroffer to U.S. proposals, and Trump threatened to destroy Iranian oil infrastructure if no deal materialized.
On April 7th, just ahead of a self-imposed deadline, a two-week ceasefire was struck. Markets surged immediately, Bitcoin broke $73,000, and ETF inflows hit a single-day record of $470 million, the highest in roughly six weeks. The relief was short-lived.
The Strait closed again following the Lebanon attacks, and the first formal U.S.–Iran negotiation on April 12th collapsed with both sides unmoved. A second ceasefire extension arrived in the third week, buying time without resolution. By month-end, Iran had proposed a three-phase negotiation framework and collected its first Hormuz passage fee, symbolically denominated in Bitcoin, though settled in stablecoins.
The more important market insight was behavioral: by late April, ceasefire extensions produced progressively smaller price reactions. The market had priced in managed, unresolved tension as the new baseline rather than treating each extension as a fresh catalyst.
On the monetary policy front, conditions remained unfavorable. March CPI printed above 3%, non-farm payrolls came in at a robust 178,000, and CME FedWatch probabilities for any 2026 rate cut collapsed entirely, with the first cut now priced for September 2027. That Bitcoin gained over 11% against this macro backdrop is a statement about the structural demand operating beneath the surface.
Bitcoin price action and on-chain structure
Bitcoin’s April trajectory followed a textbook accumulation pattern. The month opened with a classic “W” bottom forming in the $67,000–$70,000 zone, marking the exhaustion of the February–March downtrend. What followed was four consecutive weeks of gains, +2.5%, +4.32%, +6.56%, and a final push to close near $76,300.
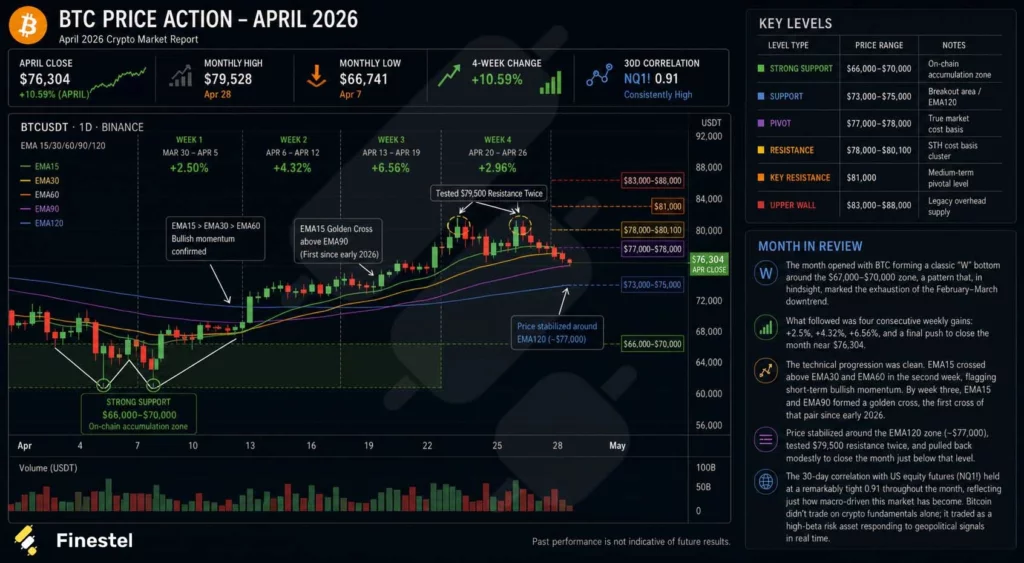
Bitcoin price action – April 2026.
The technical progression was orderly. EMA15 crossed above EMA30 and EMA60 in the second week, confirming short-term bullish momentum. By week three, EMA15 and EMA90 formed a golden cross, the first such signal since early 2026. Key resistance remained clustered between $78,000 and $80,100, representing short-term holder cost basis, and Bitcoin tested $79,500 twice before pulling back modestly into the month-end.
On-chain data told a nuanced story. Early in the month, selling pressure was dominated by profit-taking and capitulation in the $65,000–$73,000 range. By late April, the character of selling had shifted; the primary sellers were holders from the $88,000 range exiting at mild losses, a fundamentally less aggressive dynamic.
New accumulation concentrated around the $77,000–$78,000 zone, and the URPD structure showed the gap between $74,000 and $80,000 filling progressively. Long-term holders showed early stabilization: no longer distributing, but not yet accumulating aggressively either.
Institutional capital: the engine behind the recovery
April’s recovery was not retail-driven. The structural bid came from institutions, with one company making history in the process.
Bitcoin ETFs posted three consecutive weeks of significant net inflows: $786 million, $996 million, and $823 million, respectively, with a nine-consecutive-day inflow streak representing the longest such run of the year. Strategy executed the third-largest single-week Bitcoin purchase in its corporate history, 34,164 BTC at an average price of $74,395, totaling $2.54 billion, bringing its total holdings to 815,061 BTC.
The company simultaneously proposed accelerating its financing structure, moving STRC’s preferred stock dividend payments to a bi-weekly frequency to enable faster capital deployment into Bitcoin.
The institutional landscape broadened further. Goldman Sachs announced plans for a Bitcoin Premium Income ETF. Morgan Stanley advanced a Bitcoin Spot ETF toward NYSE listing. Schwab announced spot cryptocurrency trading services. BlackRock’s IBIT options open interest surpassed Deribit, a landmark in the institutionalization of Bitcoin derivatives markets.
One critical nuance: U.S. and non-U.S. institutional flows diverged sharply. Non-U.S. markets, primarily Binance, led the early recovery in buying pressure. The Coinbase premium index remained negative for roughly 20 consecutive days before recovering, indicating that American institutional capital lagged noticeably.
This asymmetry explains why the recovery, though real, lacked the explosive velocity that full U.S. re-engagement typically produces. The return of domestic institutional demand remains the primary upside catalyst heading into May.
Market structure, sentiment, and the altcoin landscape
Global spot CVD remained positive throughout April, confirming that dip-buying was the dominant market behavior.
Total crypto market capitalization expanded from $2.31 trillion to $2.60 trillion, a 12.5% gain.
Weekly trading volume peaked in the April 13–19 window with a 49% surge.
Bitcoin dominance crossed 60% by month-end, a characteristic pattern of early recovery phases where capital anchors in liquidity before rotating outward.
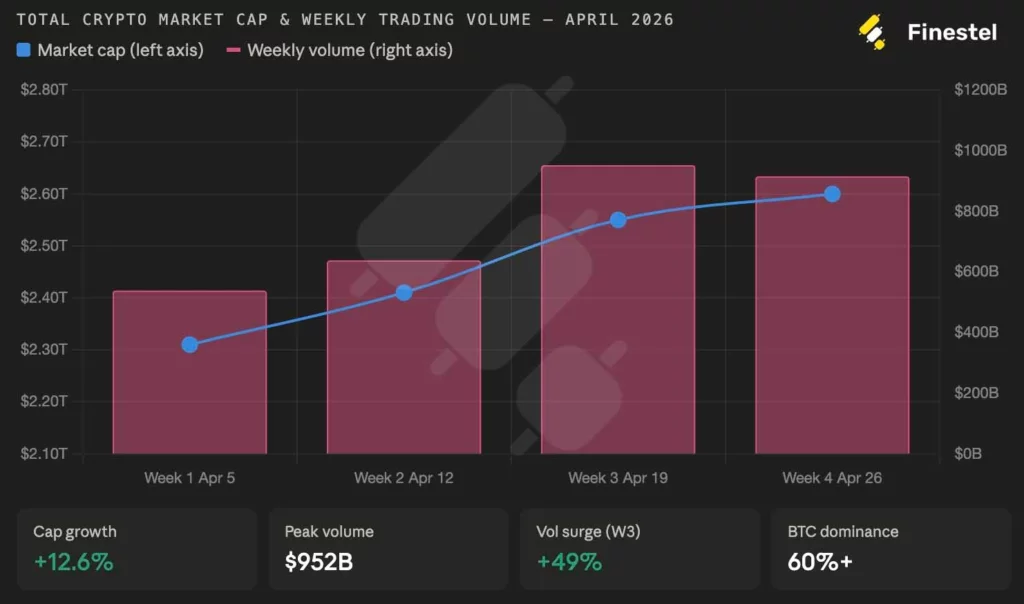
Total crypto market cap.
That rotation began materializing in April’s final week, with select altcoins showing genuine fundamental catalysts rather than pure speculation. Among the notable movers: EDGE (edgeX) gained 62.1% on real DEX revenue and a token buyback program. ZEC (Zcash) rose 42.8% following a Grayscale ETF filing and a meaningful jump in privacy pool utilization.
ARIA gained 51.7% on whale accumulation and AI gaming sector momentum. Alongside these were the inevitable meme-driven anomalies; RAVE’s 3,599% move stood as the clearest example of social-media-amplified artificial squeezes rather than durable value creation.
How professional asset managers navigated April: discipline over FOMO
Finestel’s AUM-weighted data across tracked professional asset managers revealed perhaps the most instructive lesson of the month: the managers who performed best were not those who predicted the rally, but those who had done their risk management work in February and March and entered April prepared for it.
| Allocation Category | March 2026 | April 2026 | Change | Commentary |
| BTC/ETH Core | 53.5% | 54.5% | +1.0% | Increased on dips; viewed as the highest-conviction anchor amid improving structure |
| Stablecoins | 28.0% | 23.0% | -5.0% | Selective deployment into strength; reduced dry powder as confidence returned |
| Yield-bearing DeFi / RWA | 13.0% | 13.5% | +0.5% | Slight increase for consistent yield in still range-bound environment |
| High-Conviction Alts | 5.5% | 9.0% | +3.5% | Targeted rotation into AI infrastructure, privacy, and select L1/L2 plays |
The tactical playbook these managers executed was consistent and repeatable. They defended or modestly added to BTC/ETH core positions during dips rather than trimming into weakness.
They kept leverage low and used options to hedge around the high-uncertainty events that defined April’s calendar: the CPI print, the failed April 12th negotiations, and the ceasefire extension announcements.
They rotated into altcoins incrementally, not aggressively, and only into names with identifiable catalysts rather than pure sentiment plays. And critically, they did not chase.
When Bitcoin surged past $73,000 on ceasefire day, the best-performing managers were already positioned; they had bought the $67,000–$70,000 zone during the fear, not the relief.
The underlying philosophy was one of asymmetric preparation: accept some upside drag during uncertainty in exchange for the ability to act decisively when opportunity presents itself. In a month defined by whipsawing geopolitical headlines and macro surprises, that philosophy paid off meaningfully.
Risk appetite increased across the board by month-end, but it increased in a controlled, structured way, exactly the kind of risk-taking that compounds over time rather than the kind that gives it all back on the next drawdown.
The outlook: structural progress without structural confirmation
May begins with Bitcoin better positioned than at any point since late 2025, but “better” is not the same as “clear.” The bull case requires a decisive close above $81,000 on strong volume, which would open the path toward the $83,000–$88,000 overhead supply zone.
The ingredients exist: ETF inflows are consistent, leverage has reset, and a full U.S.–Iran resolution would eliminate the dominant macro tail risk in a single headline. The bear case is simpler, failure to hold $73,000–$75,000 on any meaningful selling pressure, particularly given the dense short-term holder cost basis overhead.
The honest read: this is a high-quality recovery that requires confirmation, not a trending bull market.
Three questions will determine May’s direction: whether Bitcoin can sustain above $77,000, whether U.S. institutional capital re-engages in force, and whether the geopolitical situation evolves toward resolution or calcifies into a permanent tax on risk appetite.
April rewarded preparation. May will reward patience combined with readiness.
Disclaimer: The content of this article solely reflects the author's opinion and does not represent the platform in any capacity. This article is not intended to serve as a reference for making investment decisions.
You may also like
Chipmaker earnings growth cools to 136% as AI boom lifts S&P 500
Updated: Delta Air Lines warns that as fuel prices hit profits, airline capacity will tighten further
Delta Airlines lowers its annual profit forecast due to an expected increase in fuel costs to $6 billion. The CEO stated that ticket prices have risen by about 20% this year, with limited passenger resistance. Analysts warn that maintaining high ticket prices in 2027 is critical for improving profitability. The article includes comments from the earnings call and analyst remarks. Rajesh Kumar Singh/Shivansh Tiwary, Reuters Chicago, October 9 - Delta Airlines (DAL.N) said on Friday that, despite strong travel demand and rising ticket prices, soaring fuel costs have forced it to cut its 2026 profit expectations by nearly a quarter. So, the airline industry may need to further limit flight growth next year to protect profitability. This warning highlights the increasingly tough challenges faced by U.S. airlines. While strong demand and restricted seat growth have allowed airlines to significantly raise ticket prices and offset higher fuel costs, aggressively increasing flights to capture more demand may intensify competition, making it harder to maintain high fares and protect profits. Based in Atlanta, Delta now expects its annual fuel expenditure to increase by about $6 billion compared to last year—about $2 billion higher than its July forecast—due to the Iran war (link) causing global jet fuel prices to spike. Airlines worldwide are preparing for a prolonged fuel shock. Michael O’Leary, CEO of Ryanair Group RYA.I, said Thursday that high jet fuel prices could persist for another 12-18 months (link), adding more pressure on airlines to raise fares and control costs. https://www.reuters.com/graphics/AUTOMATED-20261008/A4A-JET-FUEL-DAILY-1Y/xmpjwjnmbvr/chart.png “In a high-cost environment, you can’t simply grow your way out,” Delta CEO Ed Bastian said on the earnings call. He noted that the industry has already taken steps to restrict capacity, but more measures will be needed next year to improve profitability. Bastian said Delta raised ticket prices about 20% this year, and passenger resistance has been limited. He is confident that even if fuel costs eventually drop, the high fares can still be maintained. Delta lowered its adjusted annual earnings per share forecast from the July prediction of $6.50-$7.50 to $5.10-$5.60. According to LSEG data, the midpoint of the new range is below analysts’ average expectation of $5.46. Third-quarter adjusted earnings per share were $1.72, four cents below analysts’ average forecast. In midday trading, shares of Delta dropped 1.7%, United Airlines UAL.O fell 1.4%, and both American Airlines AAL.O and Southwest Airlines LUV.N were down about 1%. Delta partly shields itself from rising fuel costs by owning a refinery outside Philadelphia (link), which is expected to generate over $700 million in profits this year. Even with this buffer, the airline expects its fourth-quarter fuel price to rise from $3.61 per gallon in Q3 to $4.25 per gallon. Delta forecasts adjusted fourth-quarter earnings per share to be between $1.15-$1.65, with the $1.40 midpoint roughly matching analysts’ average expectation of $1.39. Fare increases Government data shows that in the first eight months of 2026, U.S. airlines spent $42.9 billion on fuel, an increase of $13.2 billion compared to the same period last year despite slightly reduced consumption. According to the U.S. Bureau of Labor Statistics, strong demand and limited seat growth pushed average U.S. airline ticket prices up by about 25% year-on-year between April and August. https://www.reuters.com/graphics/USA-AIRLINES/FUEL/lbpgdnbzwvq/chart.png Analysts at Melius Research said that despite surging fuel costs, Delta’s ability to raise fares helps keep second-half profits roughly stable. Still, they warn that the company’s profit margin has struggled to improve over the years. “It is critical for margin improvement to maintain or raise fares in 2027,” they wrote in their research report. With industry capacity growth expected to accelerate in Q4, this challenge will likely become even tougher. Deutsche Bank analysts expect the proportion of fuel costs recouped through revenue measures to fall in Q4 and predict full recovery won’t happen until early 2027. Bastian noted that low industry returns are another reason for limiting capacity growth. He said Delta will be cautious with its 2027 capacity plan until the fuel price outlook becomes clearer. He added that international routes may account for a larger share of Delta’s capacity expansion compared to domestic routes. Currently, Delta says its premium cabins and corporate travel business remain strong, and its economy cabin business is gradually improving. With Q4 ticket bookings already exceeding 60%, Delta expects revenue to increase about 20% year-on-year, despite limited capacity growth. Executives said early booking trends for Q1 2027 are also encouraging. (For the convenience of non-native English speakers, Reuters automatically translates its reports into several
AI and Quantum: Trump's $6 Billion Plan Could Also Impact Bitcoin
Wall Street giants to release financial reports next week: stock trading revenue expected to approach $19 billion, "everyone is a winner" may be a thing of the past
According to analyst expectations compiled by Bloomberg, the combined equity trading revenue of the five major U.S. banks in the third quarter will approach $19 billion, but fixed income trading revenue is expected to drop to its lowest point of the year, and M&A activity has also cooled. Meanwhile, AI-driven cash optimization tools may lead to deposit outflows, sparking concerns about bank stocks in the market. Analysts believe that while the profit performance of each bank may further diverge, market concerns about the impact of AI may be overblown.
Crypto prices
More


