
One Chart: Overview of "Pivot Points + Long/Short Position Signals" for Gold, Crude Oil, Forex, and Stock Indices on May 28, 2026

Huitong Finance, May 28—— Below is the latest in the “One Chart Series”: a comprehensive overview of the “Pivot Points + Long/Short Positioning Signals” for gold, crude oil, forex, and stock indices, featuring chart analysis and written interpretation. By comparing the latest net long % with the previous net long % (last trading day’s net long %), a total of 13 position signals are interpreted, covering scenarios such as net long expansion, net long reduction, net short unchanged, net short turning to balanced, and more. Depending on the actual comparison results, relevant signals are displayed.
One Chart: Overview of the “Pivot Points + Long/Short Positioning Signals” for gold, crude oil, forex, and stock indices on May 28, 2026. According to the latest data released today (Thursday, May 28, 2026), as of now, there are 4 instruments in an “overbought” state (longs exceeding 80%) and 2 instruments in an “oversold” state (longs below 20%) in this chart. Among these, the instrument with the highest proportion of long positions is USD/CHF. Spot gold XAU/USD long positions: 85%, US crude oil WTI OIL long positions: 53%, EUR/USD long positions: 48%. More detailed change signals for these instruments and a comprehensive list can be found in the exclusive chart by Huitong Finance.
In terms of position change signals: 2 showed net long expansion, 9 showed net long reduction, 5 showed net short expansion, and 5 showed net short reduction. Instruments with long positions reaching 80% or more include: spot gold XAU/USD at 85%, S&P 500 Index with longs at 80%, EUR/JPY shorts at 84%, USD/JPY shorts at 94%, and USD/CHF longs at 88%.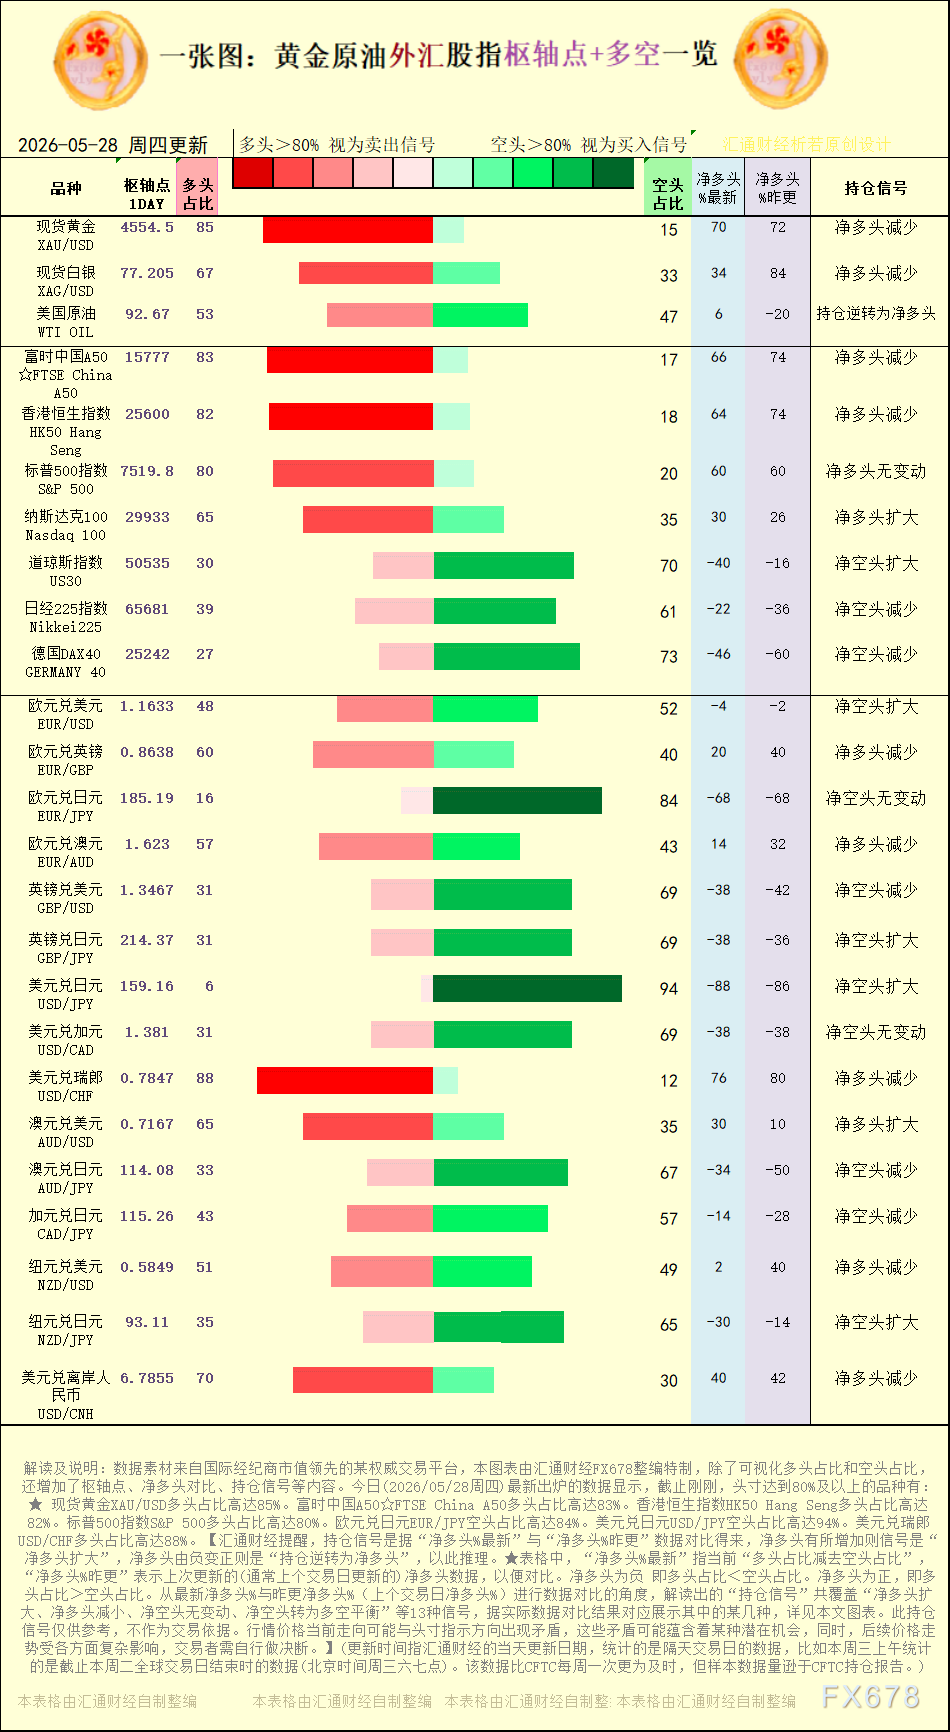
[Chart: Interpretation of Pivot Points and Long/Short Positioning Signals for Gold, Crude Oil, Forex, and Stock Indices. Source: Exclusive chart by Huitong Finance. (Click the image to enlarge)]
Those with net short reductions: Nikkei225, GERMANY 40 (DAX40), GBP/USD, AUD/JPY, CAD/JPY.
Instruments with net long expansion: Nasdaq 100, AUD/USD. Net long reductions: spot gold XAU/USD, spot silver XAG/USD, EUR/GBP, EUR/AUD, USD/CHF, NZD/USD, USD/CNH.
★In the table, “Net Long % Latest” refers to the current “long proportion minus short proportion,” “Net Long % Previous” refers to the previous update (typically the last trading day’s data) for comparison. A negative net long means longs shorts. By comparing the latest net long % with the previous update, position signals such as net long expansion, net long reduction, net short unchanged, net short turning to balanced, and more (13 in total) are interpreted. A selection of these signals based on actual results is shown in the charts in this article.
[Instruments covered in this chart include: spot gold, spot silver, US crude oil, S&P 500 Index, Nasdaq 100, Dow Jones Index, GERMANY 40, EUR/USD, EUR/GBP, EUR/JPY, EUR/AUD, GBP/USD, GBP/JPY, USD/JPY, USD/CAD, USD/CHF, AUD/USD, AUD/JPY, CAD/JPY, NZD/USD.]
Disclaimer: The content of this article solely reflects the author's opinion and does not represent the platform in any capacity. This article is not intended to serve as a reference for making investment decisions.
You may also like
Altcoin NEAR Approaches Its First Major Weekly Decision Pivot at $4.7, Can NEAR Price Continue to Pump?
Meta: Can Muse Turn AI Into Its Next Profit Engine?
Meta goes all-in on personal Agent: Muse integrates with glasses, Mac, email, connecting shopping and work
Meta announced that Muse will become the strategic core of its all-scenario "personal super intelligence." Muse not only integrates upgraded smart glasses and the portable device Charm, but also expands functionalities such as Mac control and email agent. In addition, it collaborates with retail giants like Walmart to build a shopping ecosystem, aiming to monetize through transaction commissions, demonstrating its ambition to comprehensively cultivate consumer-grade AI.
Global Bond Sell-Off Spreads! Japan 10-Year Government Bond Yield Surges to Highest Level Since 1996
Japan's 10-year government bond yield surged to 3.075%, driven by threefold pressures: US Treasury sell-off, Bank of Japan’s signals towards interest rate hikes, and concerns over fiscal expansion. The yield on 5-year US Treasury bonds breaking above 5% acted as the catalyst, while Japan's plan to raise its defense budget to 3.5% of GDP further intensified market panic. Analysts warn that as the last global anchor of low interest rates begins to shake, yen carry trades face the risk of collapsing, potentially leading to increased market volatility.
Crypto prices
More


