

 ambcrypto.com
On the 27th of May, the Depository Trust and Clearing Corporation (DTCC) announced plans to allow the tokenization of the Depository Trust Company (DTC) custodied assets on the Stellar [$XLM] network.
In a post on X, DTCC wrote,
This collaboration advances DTCC’s multi-chain strategy and expands how traditional assets move across digital ecosystems.
The post also stated that DTC-tokenized assets would be made available on the network in the first half of 2027. Following this announcement, $XLM prices surged. In the past 24 hours, the altcoin has rallied 14.92% at press time.
Can the $XLM momentum be sustained?
Shows of relative strength amidst market-wide weakness make an asset that much more noticeable. This is keenly evident in the swift capital inflows to $XLM in the derivatives market.
Traders were chasing one of the tokens in the top 25 market-cap assets that was showing short-term momentum. But perhaps the move is already over.
 Source:
$XLM/USD on TradingView
Source:
$XLM/USD on TradingView
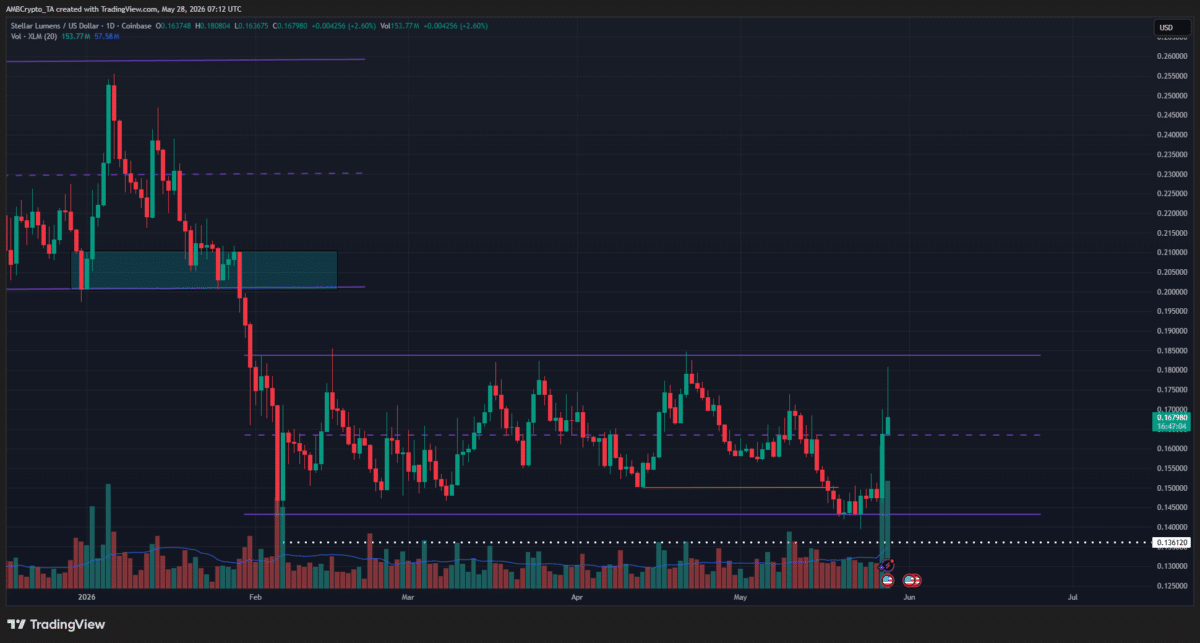
The 1-day chart showed a range formation in place between $0.143 and $0.183. Earlier in 2026, Stellar had traded within another range above $0.20, which it lost control of during the early February market crash.
The range formation meant that internal structure breaks, such as the one at $0.150 on the 17th of May, don’t matter all that much. It is the range extremes and the higher timeframe swing levels that traders should be more concerned about.
In this situation, the $0.185 area was a firm supply zone. An approach to this area should present a selling opportunity. A daily session close above $0.185 would not mark a bullish swing structure shift, and a rally beyond $0.255 is needed to accomplish this.
On the other hand, a drop below $0.136 is required to confirm a bearish continuation. Until such a breakdown occurs, traders may consider selling near $0.185 and buying around $0.145. Moreover, they should avoid letting relative strength arguments mislead them into holding long‑term positions within a bearish trend.
Final Summary
- Stellar rallied strongly after news that the DTCC chose the network for plans to enable the tokenization of DTC custodied assets on Stellar.
- This short-term momentum might not last very long. A true higher timeframe bullish trend shift was a long way away.


