

- SUI returned to a historic demand region where previous accumulation preceded a major rally toward cycle highs.
- Buyers continue defending support despite weak sentiment and persistent pressure from long-term resistance.
- Rising trading activity and repeated rebounds suggest demand remains active near key technical levels.
SUI Demand Zone remains a focal point for market participants assessing risk and opportunity. Recent price behavior has renewed attention on support levels that previously attracted strong buying interest.
Historic Support Area Returns to Focus
A post from pointed toward a familiar setup. The discussion centered on SUI’s return to a major demand region. That area previously supported one of the asset’s strongest advances.
 Source:
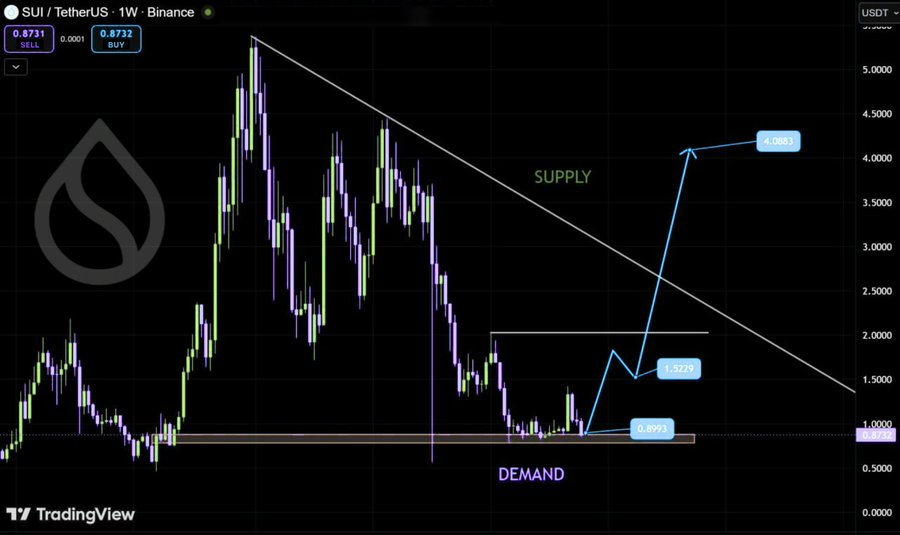
The weekly chart shows price revisiting the $0.80-$0.90 range. This zone served as a foundation during an earlier market expansion. From there, SUI later advanced toward the $5.00 region.
According to the post, sentiment has weakened considerably. Market discussions now differ from conditions seen near prior highs. Such shifts often accompany extended periods of market retracement.
The chart reflects a market searching for direction. Price remains close to an area with historical relevance. Consequently, traders continue monitoring whether demand remains intact.
Long-Term Resistance Continues Defining Market Structure
Despite support strength, broader trend conditions remain challenging. A descending supply trendline continues limiting recovery attempts. Breaks above that structure did not last from previous rallies.
Hence the long-term technical outlook is still negative. Market participants continue watching for confirmation of improvement. Resistance remains a critical factor across higher timeframes.
The chart outlines several recovery objectives above current levels. The first target appears near the $1.52 region. That area represents an important test for buyers.
A secondary objective sits near $2.00 on the chart. Beyond that level, attention shifts toward the descending trendline. A successful breakout could alter the broader technical structure.
Short-Term Activity Shows Signs of Stabilization
The daily chart presents a different perspective on market behavior. SUI as of writing, traded around during the latest session. Price remained under pressure but avoided accelerated downside movement.
Early selling pushed the asset sharply lower from nearby highs. However, buyers emerged after the initial decline. The market subsequently entered a relatively stable trading range.
Repeated tests of the $0.87 area attracted demand. Each rebound reduced concerns about immediate breakdown risks. Consequently, traders continue viewing that level as key support.
Trading volume increased substantially during the session. Higher activity suggests active participation from both sides. For now, the market remains in consolidation rather than capitulation.
The SUI Demand Zone continues attracting attention across multiple timeframes. While resistance remains firmly established, buyers have repeatedly defended support. Market participants are now watching whether accumulation can eventually challenge the prevailing downtrend.



