
Not $60,000: Analyst Reveals The Best Time To Actually Start Buying Bitcoin

By:Newsbtc
Bitget offers one-stop trading for cryptocurrencies, stocks, and gold. Trade now!
A welcome pack worth 6200 USDT for new users! Sign up now!
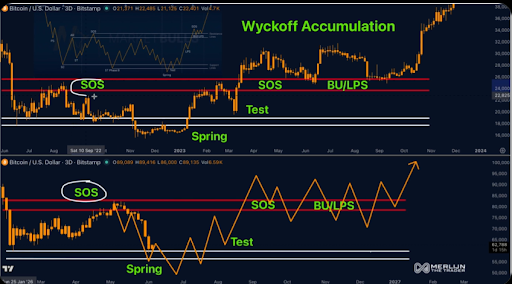
Bitcoin’s crash over the weekend has brought the $60,000 level back into the market conversation, but crypto analyst Merlijn The Trader believes the real opportunity may come at a lower price. Technical analysis comparing the current Bitcoin structure with the 2022 Wyckoff accumulation phase shows that buying the current bounce would be a costly mistake because the real accumulation window has not even opened yet.
Bitcoin’s Wyckoff Setup Points Below $60,000
To understand where Merlijn The Trader believes Bitcoin is headed, it helps to understand where it has been. Merlijn’s analysis is built around the Wyckoff accumulation model, using Bitcoin’s 2022 bottoming structure as the reference point.
Back in that cycle, Bitcoin formed a spring around $15,500, recovered into the $23,000 region, where eager buyers rushed in, believing the worst was over. However, it was not. The price action then delivered a secondary wave of selling that crushed late buyers before the genuine markup phase began.
var rnd = window.rnd || Math.floor(Math.random()*10e6); var pid607465 = window.pid607465 || rnd; var plc607465 = window.plc607465 || 0; var abkw = window.abkw || ''; var absrc = 'https://servedbyadbutler.com/adserve/;ID=172179;size=0x0;setID=607465;type=js;sw='+screen.width+';sh='+screen.height+';spr='+window.devicePixelRatio+';kw='+abkw+';pid='+pid607465+';place='+(plc607465++)+';rnd='+rnd+';click=CLICK_MACRO_PLACEHOLDER'; document.write('
');
if (!window.AdButler){(function(){var s = document.createElement("script"); s.async = true; s.type = "text/javascript";s.src = "https://servedbyadbutler.com/app.js";var n = document.getElementsByTagName("script")[0]; n.parentNode.insertBefore(s, n);}());}
var AdButler = AdButler || {}; AdButler.ads = AdButler.ads || []; var abkw = window.abkw || ""; var plc366606 = window.plc366606 || 0; (function(){ var divs = document.querySelectorAll(".plc366606:not([id])"); var div = divs[divs.length-1]; div.id = "placement_366606_"+plc366606; AdButler.ads.push({handler: function(opt){ AdButler.register(172179, 366606, [728,90], "placement_366606_"+opt.place, opt); }, opt: { place: plc366606++, keywords: abkw, domain: "servedbyadbutler.com", click:"CLICK_MACRO_PLACEHOLDER" }}); })();

The analyst believes the 2026 structure is developing in a similar way. His chart shows Bitcoin currently trading around the same stage where the market previously moved through a sign of strength, lost momentum, and later dropped into the spring phase. The important message is that any bounce from the current region may not be the point where traders should become aggressive on their buying.
Another important message from the analysis is that the $60,000 level may be misleading. Bitcoin fell below that level during the recent selloff, and it is important as a support because it is close to the 200-week moving average.
var rnd = window.rnd || Math.floor(Math.random()*10e6); var pid607472 = window.pid607472 || rnd; var plc607472 = window.plc607472 || 0; var abkw = window.abkw || ''; var absrc = 'https://servedbyadbutler.com/adserve/;ID=172179;size=0x0;setID=607472;type=js;sw='+screen.width+';sh='+screen.height+';spr='+window.devicePixelRatio+';kw='+abkw+';pid='+pid607472+';place='+(plc607472++)+';rnd='+rnd+';click=CLICK_MACRO_PLACEHOLDER'; document.write('
');
if (!window.AdButler){(function(){var s = document.createElement("script"); s.async = true; s.type = "text/javascript";s.src = "https://servedbyadbutler.com/app.js";var n = document.getElementsByTagName("script")[0]; n.parentNode.insertBefore(s, n);}());}
var AdButler = AdButler || {}; AdButler.ads = AdButler.ads || []; var abkw = window.abkw || ""; var plc452518 = window.plc452518 || 0; (function(){ var divs = document.querySelectorAll(".plc452518:not([id])"); var div = divs[divs.length-1]; div.id = "placement_452518_"+plc452518; AdButler.ads.push({handler: function(opt){ AdButler.register(172179, 452518, [728,90], "placement_452518_"+opt.place, opt); }, opt: { place: plc452518++, keywords: abkw, domain: "servedbyadbutler.com", click:"CLICK_MACRO_PLACEHOLDER" }}); })();
Bitcoin Price Chart. Source: @MerlijnTrader On X
The DCA Zone That Could Matter Most
The Wyckoff setup by Merlijn identifies five phases: Phase A stops the downtrend via a selling climax, Phase B builds the cause as institutions accumulate within the range, Phase C delivers the spring, which is a final shakeout below support, Phase D marks up within the range with a last point of support and a sign of strength, and Phase E is the breakout and uptrend.

Bad News For Bitcoin: Historical Lows Show The Bottom Actually Lies Below $30,000
Merlijn’s chart places Bitcoin inside this structure in 2026, with the Spring phase still ahead. The analyst’s projection is that a Spring to $50,000 is incoming, followed by a bounce rally to the $65,000-$70,000 range. That bounce, he warns, will once again lure in bulls who will buy into what appears to be a recovery, the same trap that caught investors in 2023.
BTC price moving lower | Source:
At the time of writing, Bitcoin is trading at $62,891.
0
0
Disclaimer: The content of this article solely reflects the author's opinion and does not represent the platform in any capacity. This article is not intended to serve as a reference for making investment decisions.
Understand the market, then trade.
Bitget offers one-stop trading for cryptocurrencies, stocks, and gold.
Trade now!
You may also like
Solana rises 5%, breaks $110 resistance as ZETA token migration fuels rally
Cointurk•2026/09/21 15:00

AI Computing Power Boom Faces Doubts from Influencers: Rothschild Shorting "AI New Cloud," "Big Bear" Warns of $3 Trillion Off-Balance-Sheet Commitments
From the perspective of data center project economics, the Rothschild research report investigates how much shareholder return remains after GPU rental income covers equipment depreciation, operating expenses, and financing costs.
智通财经•2026/09/21 13:51
HP (HPQ.US) Cools Down PC Industry Expectations: Shipments to Decline in 2027, Can "Growth-Driven Revenues" Hold Up?
HP warned in its filing to the SEC that PC shipments will decline by a mid-single digit percentage in 2027, stating that this aligns with third-party forecasts. The stock fell over 5% in pre-market trading.
智通财经•2026/09/21 13:46

Crypto prices
More
Bitcoin
BTC
$85,953.47
+6.54%

Ethereum
ETH
$2,747.23
+6.27%

Tether USDt
USDT
$0.9996
-0.00%

BNB
BNB
$795.67
+5.54%

XRP
XRP
$1.5
+8.85%

USDC
USDC
$0.9999
-0.00%

Solana
SOL
$118.42
+9.34%

TRON
TRX
$0.3450
+0.05%

Zcash
ZEC
$1,528.25
+6.15%

Hyperliquid
HYPE
$94.29
+3.49%
How to buy BTC
Bitget lists BTC – Buy or sell BTC quickly on Bitget!
Trade now
Become a trader now?A welcome pack worth 6200 USDT for new users!
Sign up now