
Can Zcash rebound toward $500 or is the post-crash rally over?

Zcash has rebounded more than 40% from its June 5 low after a vulnerability-driven collapse erased half of its value in less than two days, but the recovery has slowed as traders weigh unresolved supply concerns and weakening market conditions.
- Zcash rebounded more than 40% after a vulnerability-driven crash erased half its value in under two days.
- Traders remain cautious despite the Orchard bug fix, with supply concerns and weak crypto sentiment limiting upside.
- Technical indicators show consolidation, with resistance near $440-$493 and key support around $400.
According to data from crypto.news, Zcash (ZEC) price plunged from a June 4 high near $644 to a low around $309 by June 5 after developers disclosed a critical flaw in the network’s Orchard shielded pool. The token later recovered to nearly $475 on June 9 before giving back part of those gains, trading near $430 on June 11.
The initial selloff followed the disclosure of a long-standing security vulnerability discovered by Shielded Labs security researcher Taylor Hornby during an independent audit. According to technical findings published by the Zcash development ecosystem, the flaw had existed for roughly four years and could theoretically have allowed an attacker to create unlimited counterfeit ZEC within the Orchard shielded pool.
Although internal turnstile accounting found no evidence of abnormal inflation entering the public supply, Zcash developers acknowledged that the privacy design of the shielded pool made it impossible to independently verify whether the bug had ever been exploited historically.
Selling pressure intensified after BitMEX co-founder Arthur Hayes announced on June 4 that he had completely exited his ZEC position. According to CoinGlass data, derivatives liquidations remained relatively limited during the decline, indicating that panic spot selling and institutional de-risking played a larger role in the crash than leveraged futures positions.
A recovery began after developers completed emergency mitigation measures. According to the Zcash development team, Orchard transactions were temporarily disabled before the NU6.2 network upgrade introduced a corrected circuit matrix and a new verification key designed to permanently close the vulnerability.
Electric Coin Company CEO Josh Swihart later confirmed that the patch had been successfully deployed and stated that the planned Ironwood upgrade would introduce mechanisms intended to improve public supply verification.
Even after the fix, however, investor caution has remained visible. At the same time, crypto markets have faced external pressure from persistent Bitcoin ETF outflows and rising geopolitical tensions, reducing appetite for higher-risk assets.
Why Zcash remains trapped below key resistance
Zcash price action since June 9 suggests the recovery rally has stalled beneath an important resistance zone.
On the four-hour chart, ZEC failed to sustain a breakout above the 0.382 Fibonacci retracement level near $493 after reaching approximately $475. The rejection occurred shortly below that resistance area, sending price back toward the middle of its post-crash range.
Meanwhile, the ascending channel that carried the rebound from the June 5 bottom has broken to the downside, indicating that buying momentum has weakened.
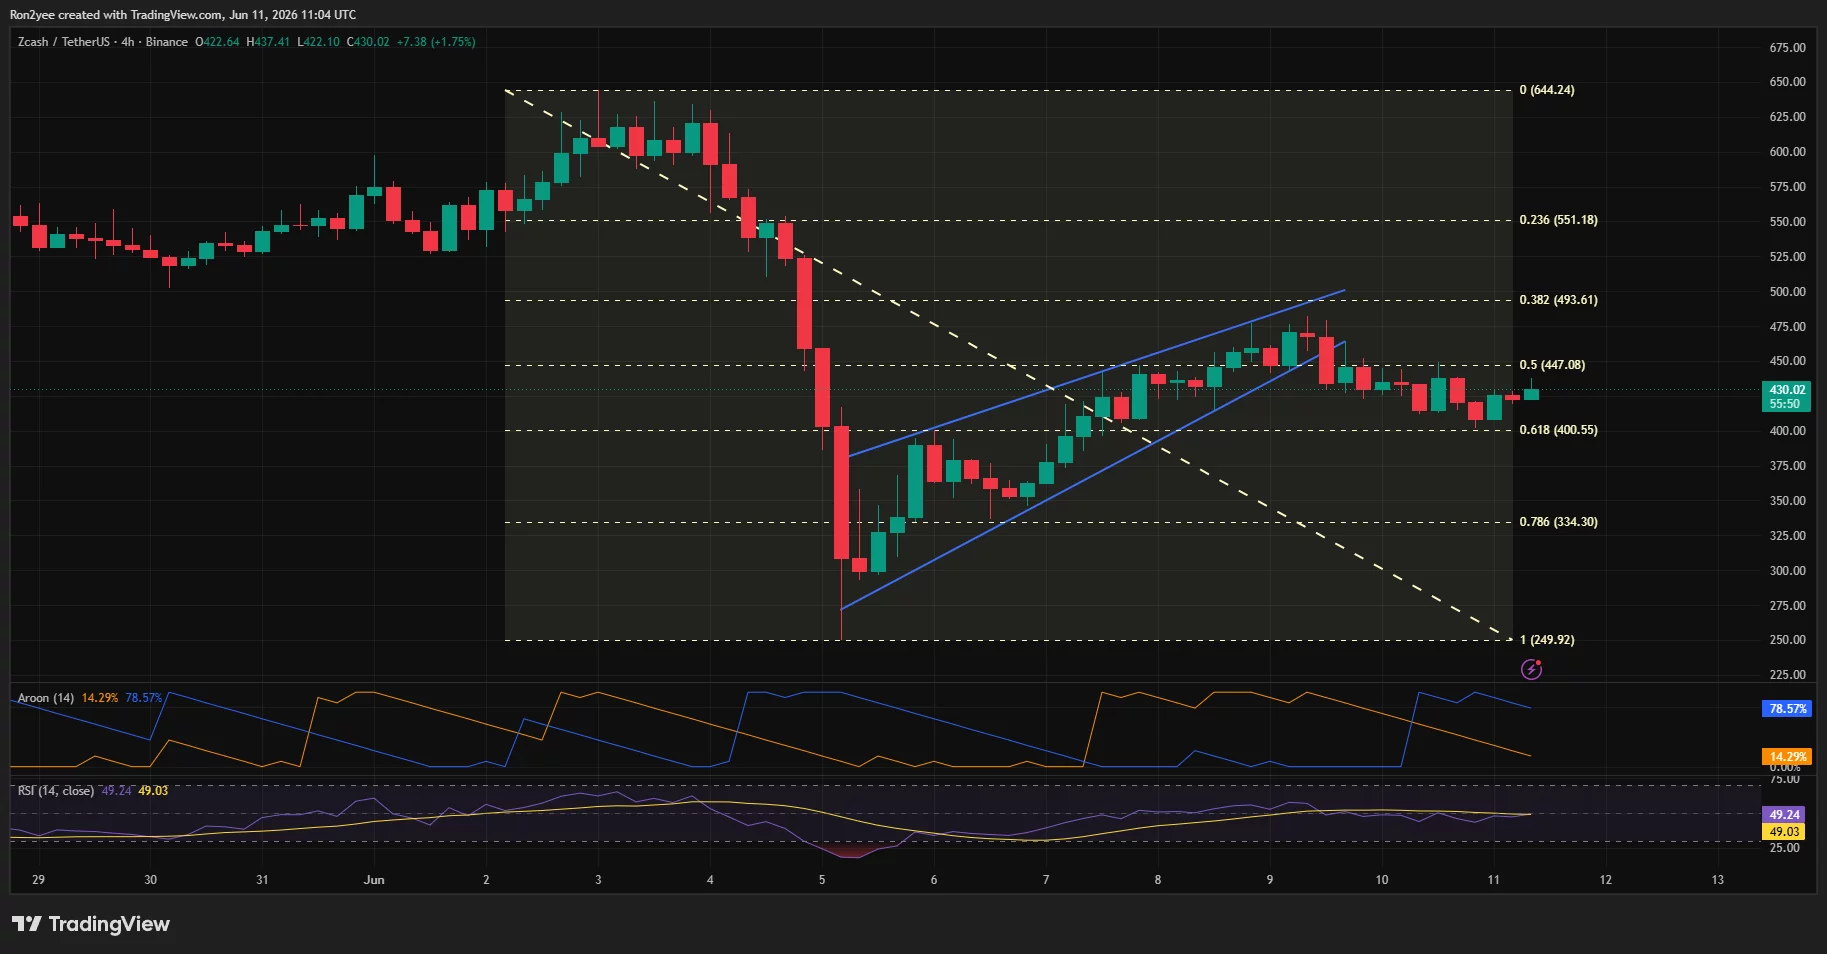 Zcash price has broken below an ascending channel on the 4-hour chart — June 11 | Source:
crypto.news
Zcash price has broken below an ascending channel on the 4-hour chart — June 11 | Source:
crypto.news
CoinGlass liquidation heatmap data also shows a large concentration of short positions between $440 and $460. Those levels sit directly above the current market price and coincide with Fibonacci resistance levels identified on the four-hour chart.
As a result, traders appear reluctant to commit aggressively in either direction while ZEC price remains trapped between overhead resistance and support near the $400 area.
Technical indicators show consolidation rather than trend continuation
Technical indicators currently point to consolidation instead of a decisive continuation of the June rebound.
On the four-hour chart, the Relative Strength Index sits near 49, placing momentum in neutral territory. Aroon readings continue to favor buyers, with Aroon Up near 79 and Aroon Down near 14, though the indicator has softened from earlier recovery highs.
Looking at the daily chart, the 50-day moving average remains above price and continues to act as resistance following the vulnerability-driven collapse. Beneath the market, the 200-day moving average is providing support and marks a key level watched by long-term holders.
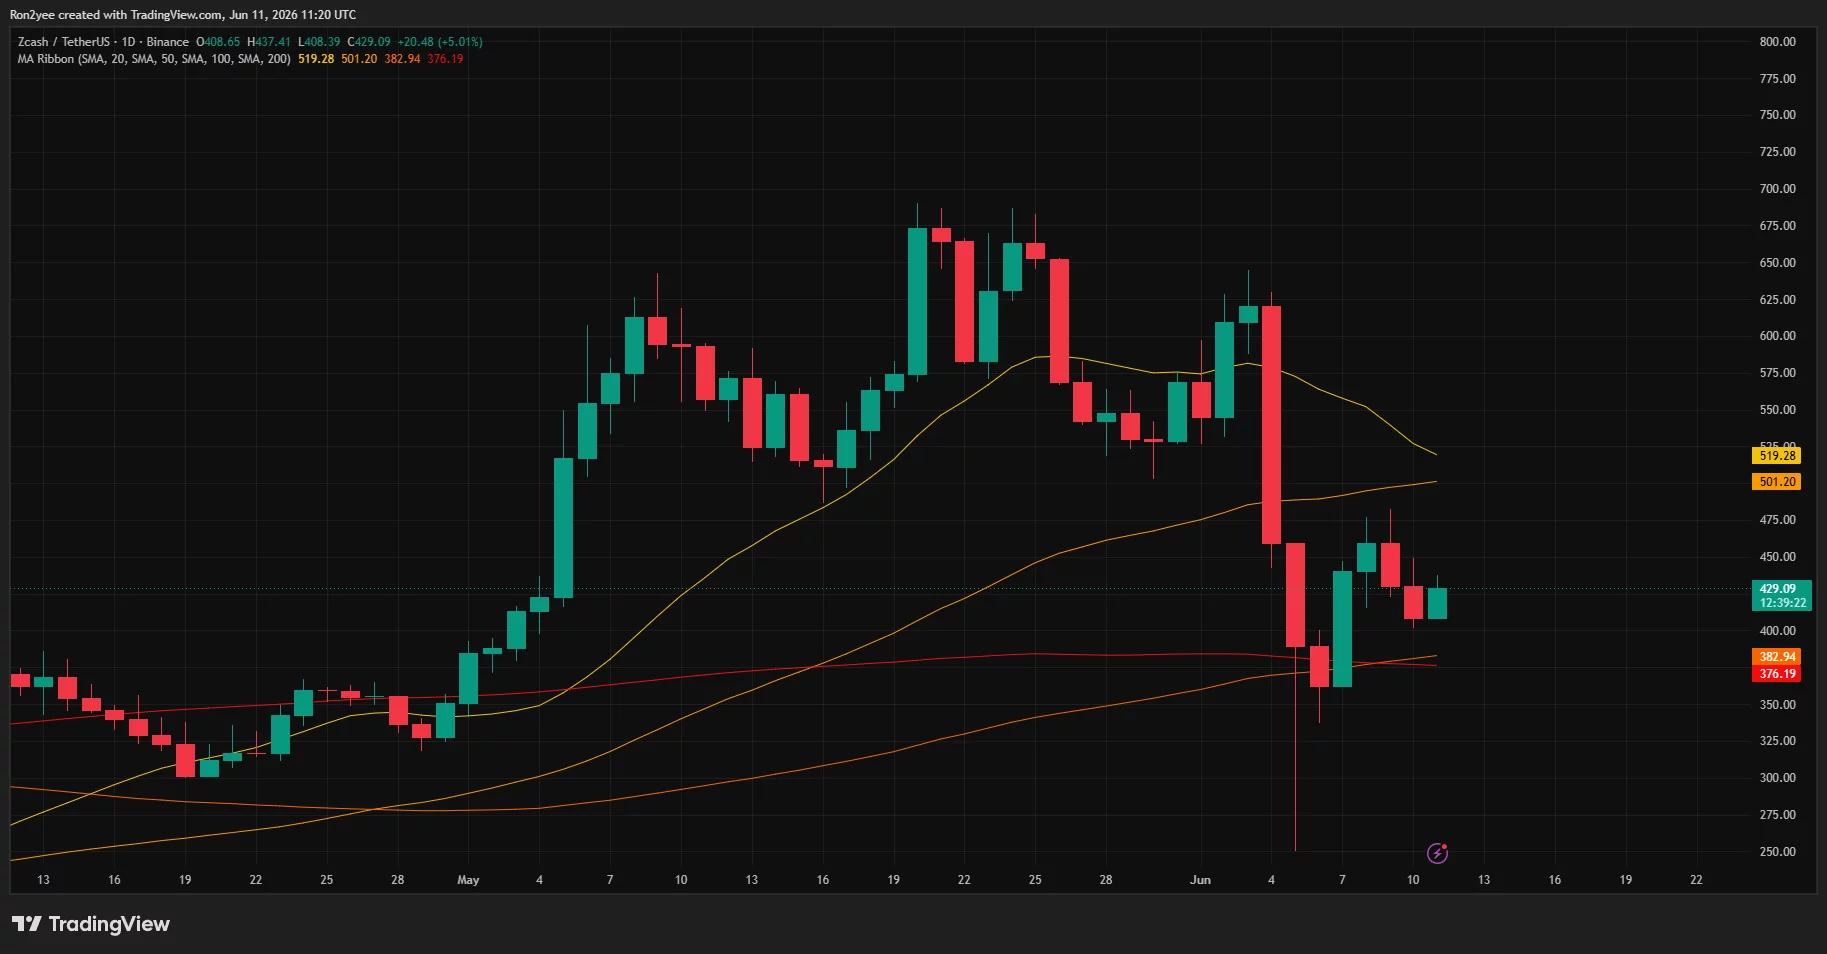 Zcash daily price chart — June 11 | Source:
crypto.news
Zcash daily price chart — June 11 | Source:
crypto.news
According to CoinGlass liquidation data, a break above $440 could trigger short liquidations and potentially push ZEC toward the $450-$460 zone. Conversely, a move below the $400 support region could expose the market to another liquidity sweep toward the $334 area, which aligns with the 0.786 Fibonacci retracement level.
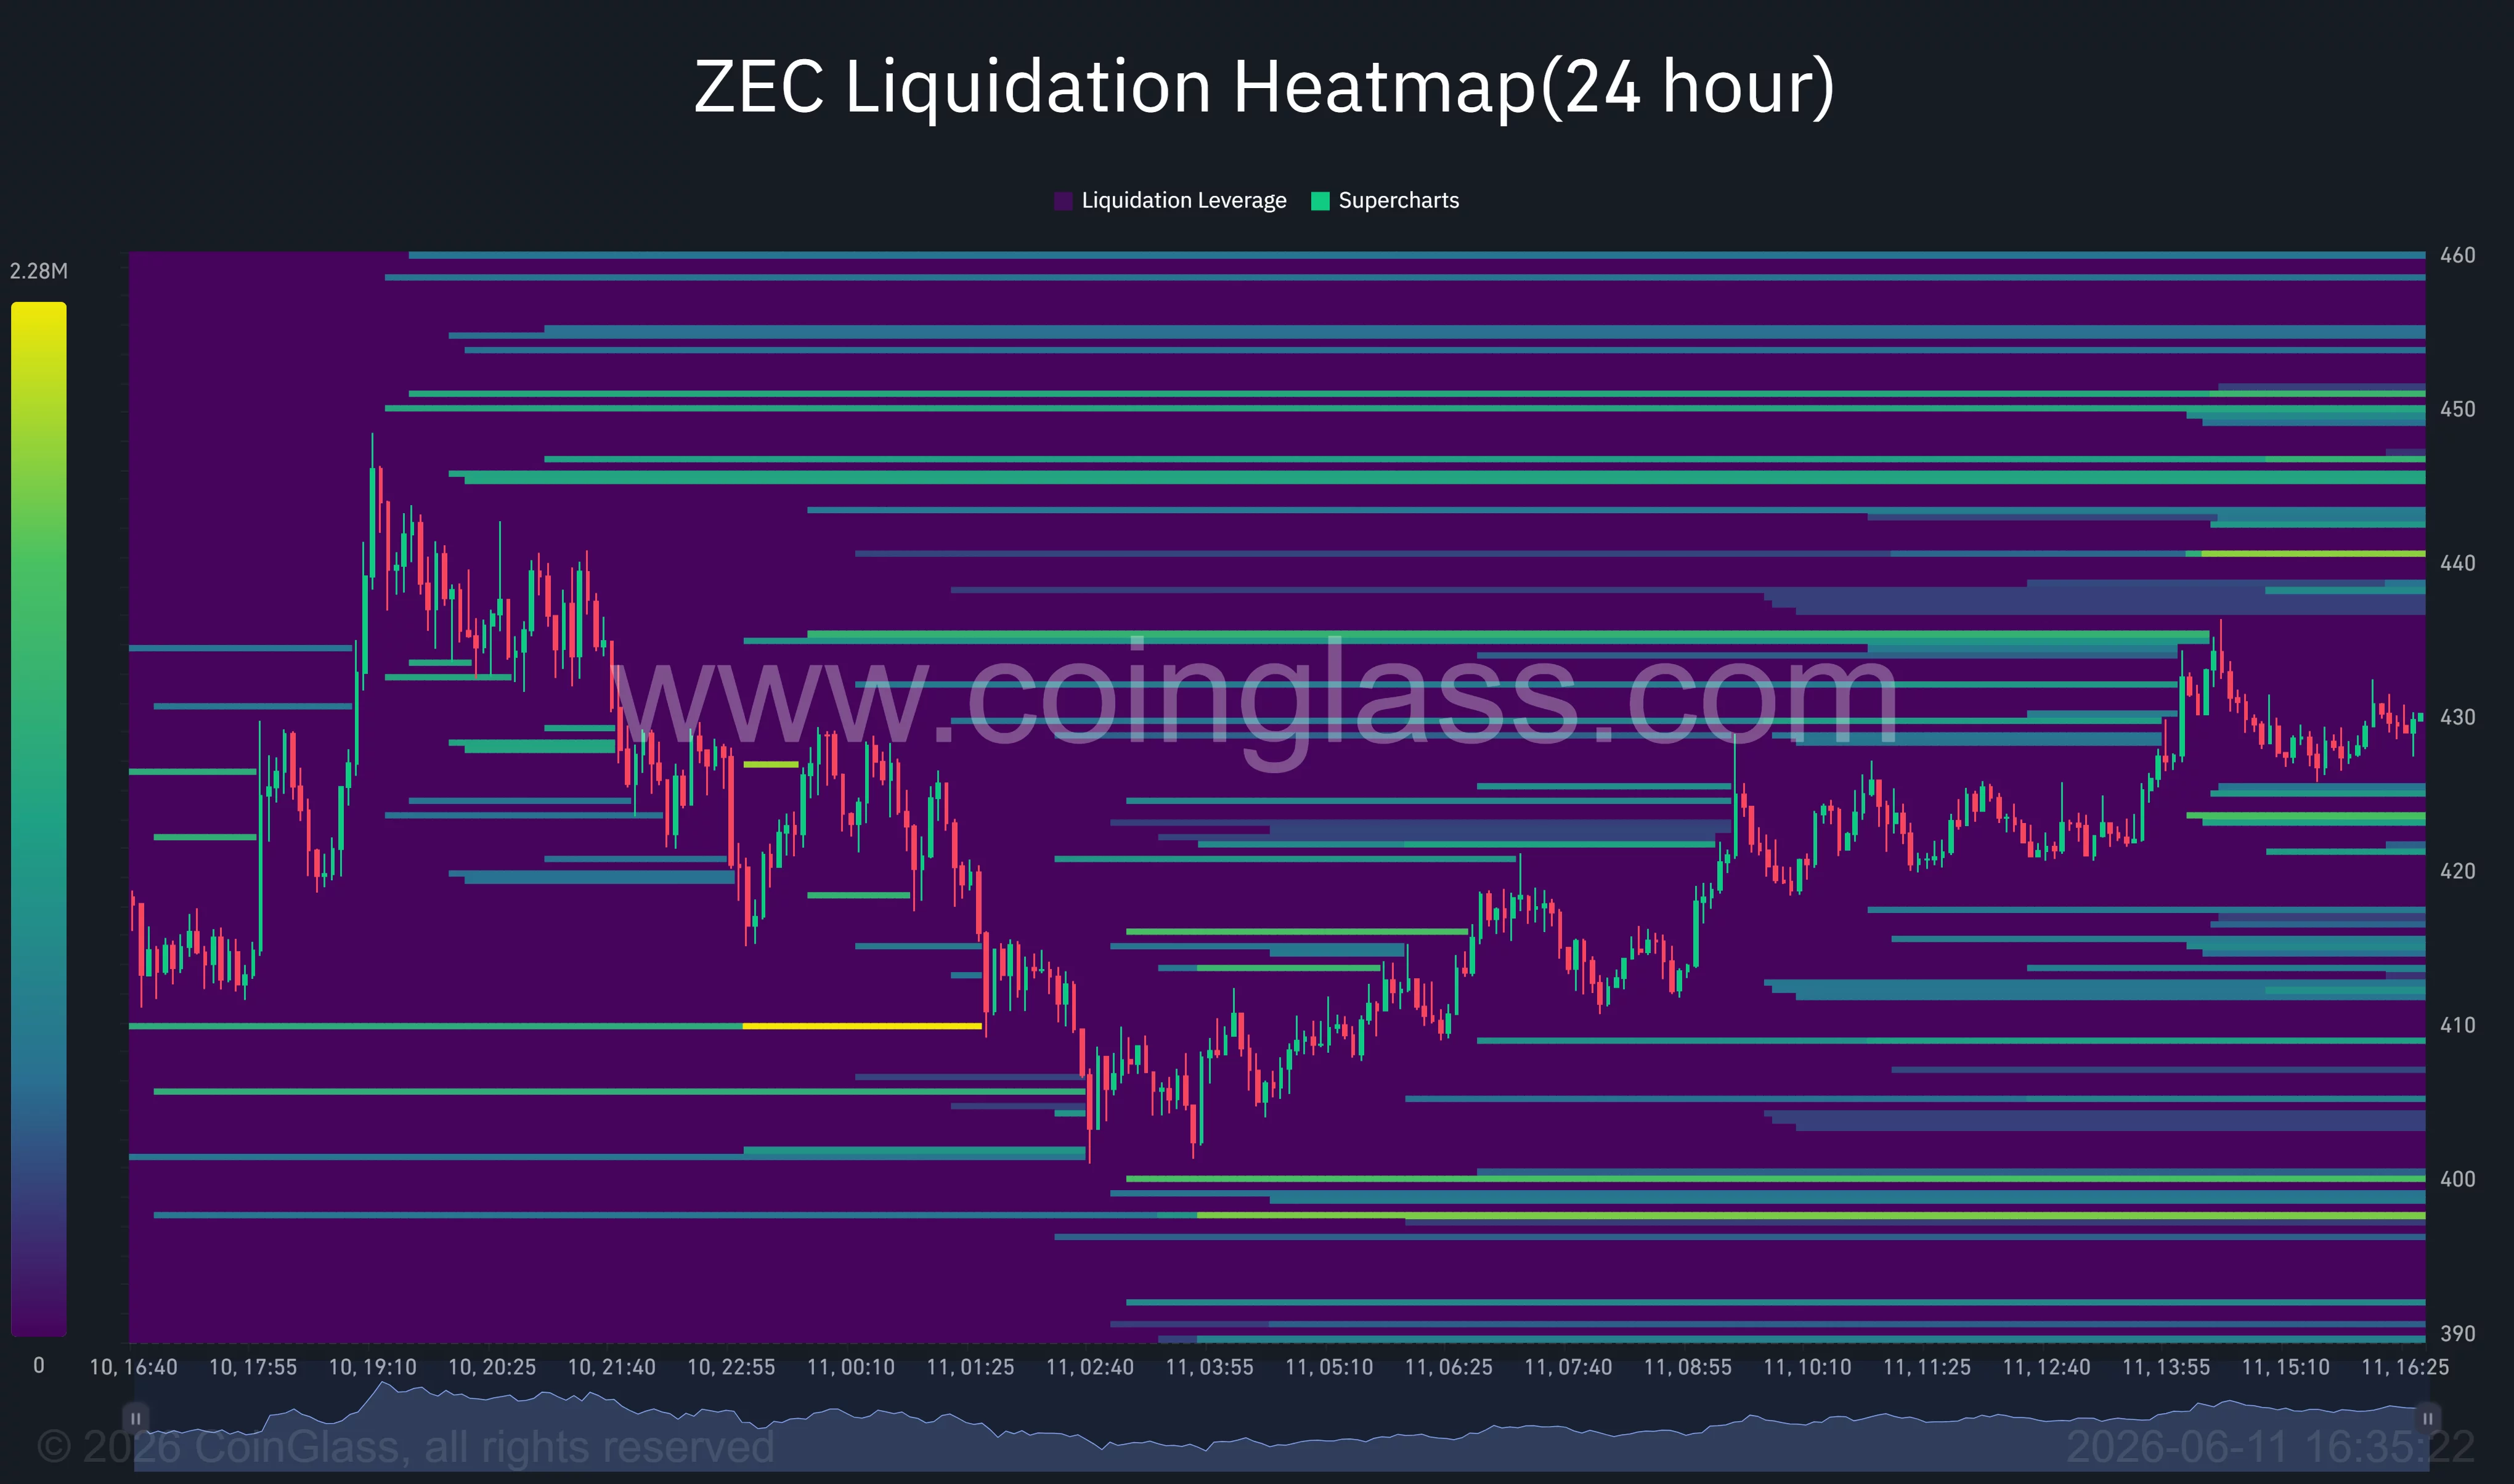 Zcash liquidation heatmap | Source:
CoinGlass
Zcash liquidation heatmap | Source:
CoinGlass
For now, Zcash appears caught between improving confidence in the network’s security and lingering questions about the impact of the vulnerability that triggered one of the token’s sharpest declines in recent years.
Disclaimer: The content of this article solely reflects the author's opinion and does not represent the platform in any capacity. This article is not intended to serve as a reference for making investment decisions.
You may also like
AI demand drives TSMC to accelerate capacity expansion, 2nm monthly production aims for 120,000 wafers by year-end
According to reports, industry giants such as Apple, Nvidia, and AMD have collectively increased their orders by 10% to 20%, directly boosting TSMC's 2nm monthly production capacity to 120,000 wafers by the end of the year, which exceeds the previous estimate by more than 20% and brings forward the 2027 target by two years. For the first time in history, five factories will ramp up production simultaneously, and the annual compound growth rate of capacity from 2026 to 2028 will reach as high as 70%.
Long-term US Treasury Sell-off Continues! 10-Year Treasury Yield Breaks 5.2% Again, “AI Boom vs. Rising Financing Costs” Narrative Showdown Intensifies
On Monday, oil prices rose and US Treasury bonds were sold off again as former US President Donald Trump rejected Iran's latest proposal to reopen the Strait of Hormuz, heightening concerns about inflation.
Banks Have Been Earning Effortlessly from Idle Funds for Years—Will AI Agents Change Everything?
For years, banks have profited from customers' idle funds, but AI agents may be about to change this situation.
Goldman Sachs: US stocks are showing a "strong index, weak confidence" pattern; catch-up rally may become the main theme of the next phase
Goldman Sachs stated that the current U.S. stock market is showing an unusual pattern: while index performance is strong, investor confidence remains weak. This suggests that the market still has further upside potential, and stocks that previously lagged behind leading AI stocks may soon experience a catch-up rally.

Crypto prices
More


