
A visual overview of commodity support and resistance: Gold, Silver, Oil, Gas + Platinum, Palladium, Copper, and Agricultural Futures (June 26, 2026)

Huitong Finance June 26 —— A chart showing commodity support and resistance: Gold, silver, oil and gas + platinum, palladium, copper + agricultural futures. Last updated on Friday, June 26, 2026, at 07:15. It specifically covers 14 varieties, including gold, silver, platinum, palladium, copper + crude oil, natural gas, fuel oil + wheat, corn, cotton. For more details, please refer to the Huitong Finance custom chart.
A chart showing commodity support and resistance: Gold, silver, oil and gas + platinum, palladium, copper + agricultural futures. Last updated on Friday, June 26, 2026, at 07:15. It specifically covers 14 varieties, including gold, silver, platinum, palladium, copper + crude oil, natural gas, fuel oil + wheat, corn, cotton. For more details, please refer to the content of the Huitong Finance custom chart.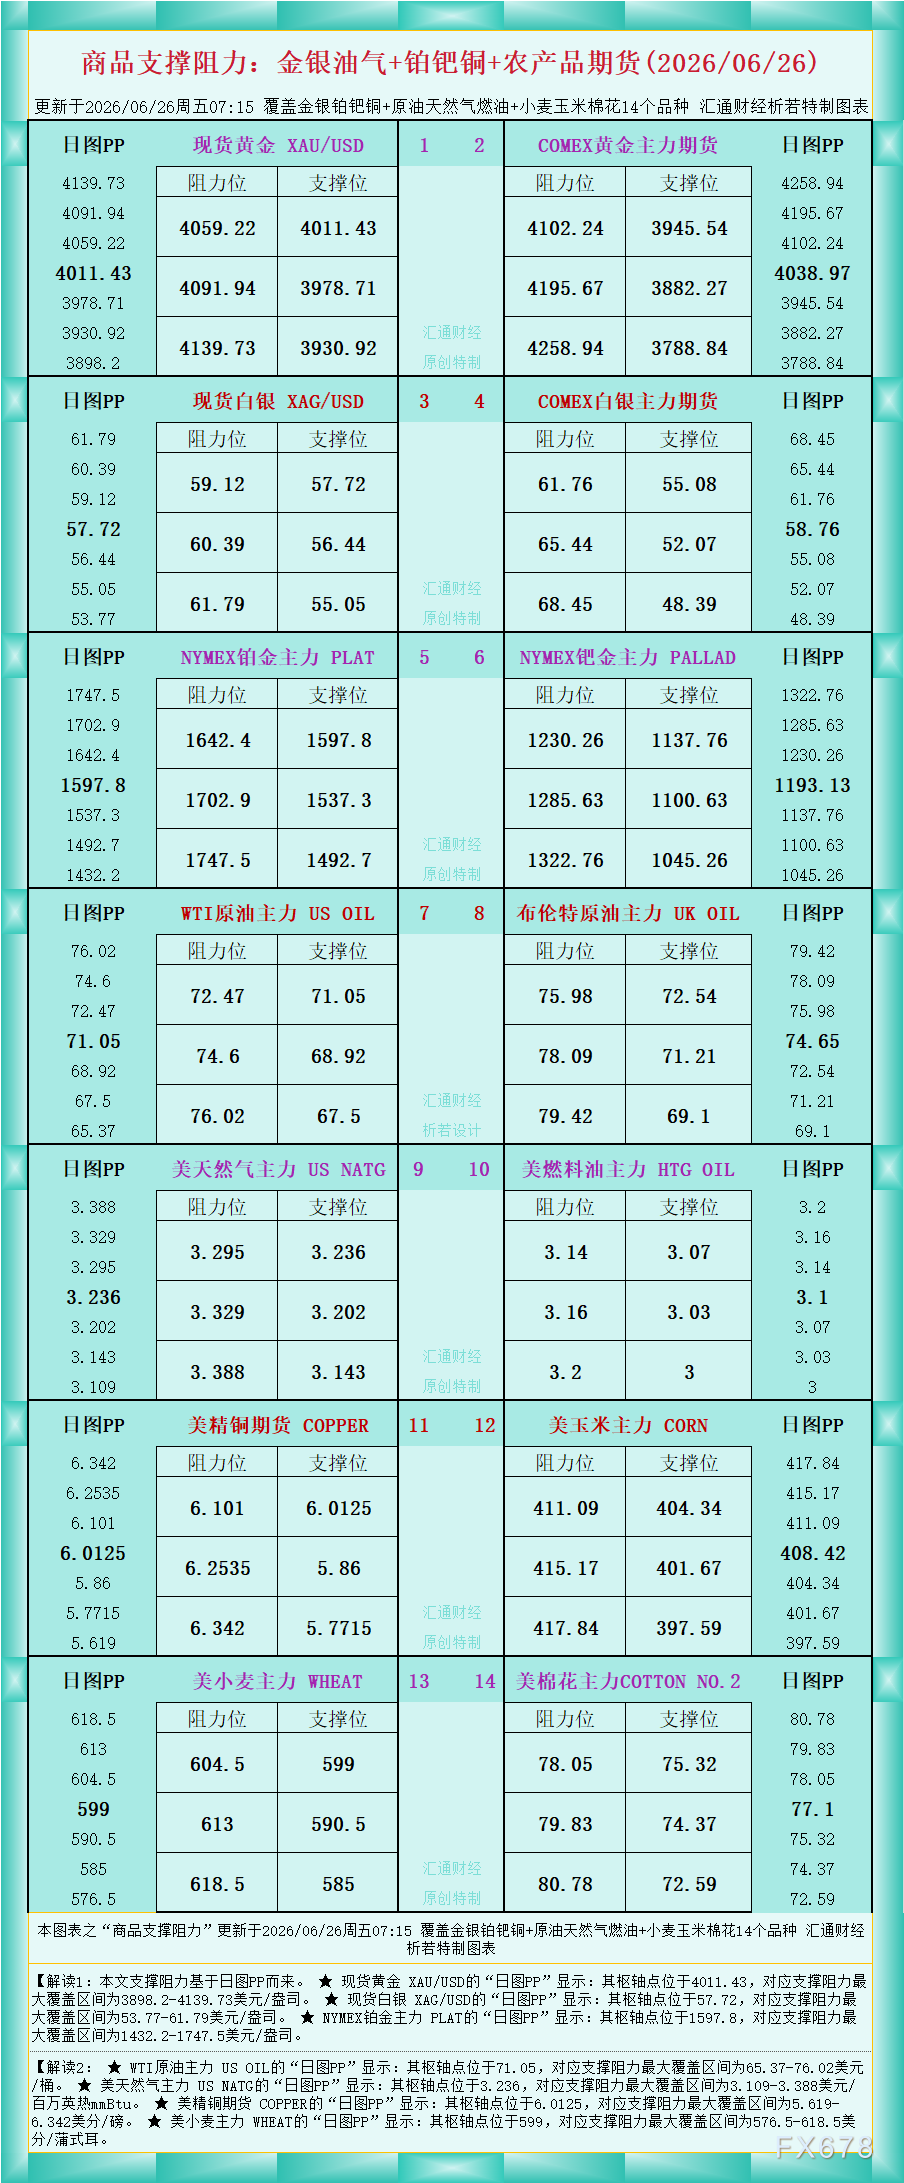
According to the chart data, Interpretation 1: The support and resistance in this article are based on the daily chart PP.
★ The daily chart PP for spot gold XAU/USD shows: its pivot point is at 4011.43, with the largest support and resistance range covered between $3898.2–$4139.73/oz.
★ The daily chart PP for spot silver XAG/USD shows: its pivot point is at 57.72, with the largest support and resistance range covered between $53.77–$61.79/oz.
★ The daily chart PP for NYMEX platinum main contract PLAT shows: its pivot point is at 1597.8, with the largest support and resistance range covered between $1432.2–$1747.5/oz.
Interpretation 2:
★ The daily chart PP for WTI crude oil main contract US OIL shows: its pivot point is at 71.05, with the largest support and resistance range covered between $65.37–$76.02/barrel.
★ The daily chart PP for US natural gas main contract US NATG shows: its pivot point is at 3.236, with the largest support and resistance range covered between $3.109–$3.388/million British thermal units mmBtu.
★ The daily chart PP for US copper futures COPPER shows: its pivot point is at 6.0125, with the largest support and resistance range covered between 5.619–6.342 cents/pound.
★ The daily chart PP for US wheat main contract WHEAT shows: its pivot point is at 599, with the largest support and resistance range covered between 576.5–618.5 cents/bushel.
For more interpretations on other varieties, please refer to the chart.
Disclaimer: The content of this article solely reflects the author's opinion and does not represent the platform in any capacity. This article is not intended to serve as a reference for making investment decisions.
You may also like
Fed’s Hawkish Talons Shine, Bond Market Believes: US Treasury Yield Curve Flattens as Rate Hike Bets Heat Up
The bond market is showing increasing confidence that Federal Reserve Chairman Kevin Walsh will fulfill his commitment to curb inflation—currently, the inflation rate has exceeded policymakers' target level for five consecutive years.

"Hawkish Rate Hike"! Walsh's "Major Shift"
The Federal Reserve unanimously raised interest rates by 25 basis points in September, with Waller fulfilling his hawkish commitments through decisive action and making it clear that current financial conditions are not tight, and this hike only removes "some accommodation," using strong language. UBS believes that Waller's policy response function has undergone a substantial shift compared to his predecessor—he is more sensitive to inflation and supply shocks, less concerned about the labor market, and has set a higher threshold for restrictive policy. The risks are clearly tilted toward interest rates remaining elevated for a longer period.
CITIC Securities: The Fed's September rate hike meets expectations, oil prices become key to follow-up, another rate hike of 25bps possible within the year
The pace and extent of future interest rate hikes by the Federal Reserve largely depend on oil prices. According to CITIC Securities, the Federal Reserve is expected to raise interest rates by another 25bps within this year and may remain on hold next year.

The Federal Reserve "raised interest rates as expected," but the market is concerned about "how many more times will there be after this?"
Analysts believe that Walsh emphasized closely monitoring inflation trends, but with only one month of data before the October meeting, it is insufficient to establish a "trend" for judgment, so action is expected again in December. The dot plot shows that 16 officials anticipate one more rate hike this year, but with the 10-year US Treasury yield surpassing 5%, traders are betting on a tighter path than the official dot plot suggests.
Crypto prices
More


