
Bitget App
Trade smarter
Buy cryptoMarketsTradeFuturesEarnAISquareMore
Solana Price Prediction: $75 Breakout or Another SOL Bull Trap?

Solana Price Prediction: $75 Breakout or Another SOL Bull Trap?

CryptoNewsNetCryptoNewsNet2026/06/27 19:15
By:CryptoNewsNet
Back to the list

Solana Price Prediction: $75 Breakout or Another SOL Bull Trap?

  coinpaper.com 15 m
Solana Price Prediction: $75 Breakout or Another SOL Bull Trap? image 0

Solana is pushing toward a key resistance zone as traders watch whether the rebound can turn into something stronger. A move above $74.98 could open the way toward $80-$86, but failure there may send $SOL back toward support.

Solana Rally Faces Key Test Between $73 and $89

Solana is attempting a recovery from its June low, but the broader chart still shows a bearish corrective structure.
Solana Price Prediction: $75 Breakout or Another SOL Bull Trap? image 1

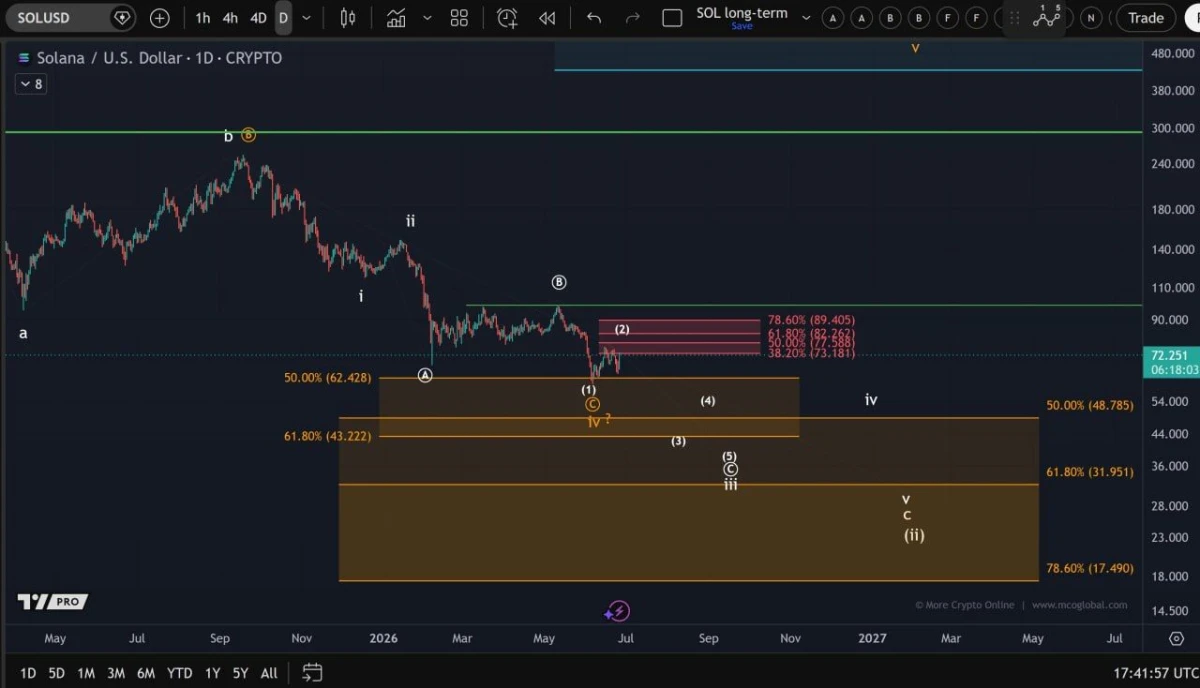
$SOL/USD Daily Chart. Source: @Morecryptoonl on X

The chart shows $SOL trading near $72.25 as it approaches the first major resistance zone between $73.18 and $89.40. This area could decide whether the current rebound continues or fails as another bear-market rally.

The preferred Elliott Wave count treats the move from the June low as a wave 2 bounce, meaning sellers could regain control if $SOL rejects from resistance. A break above the zone would improve the outlook, but it would not confirm a full trend reversal on its own.

For a stronger bullish case, Solana would need to break above resistance, form a clear five-wave advance and then hold a corrective pullback. Until that happens, the current rally remains at risk of fading.

Solana Faces $75 Test as Short-Term Rebound Builds

Solana is trading near $70.50 as buyers try to extend the rebound, but the next major test sits near $75.
Solana Price Prediction: $75 Breakout or Another SOL Bull Trap? image 2

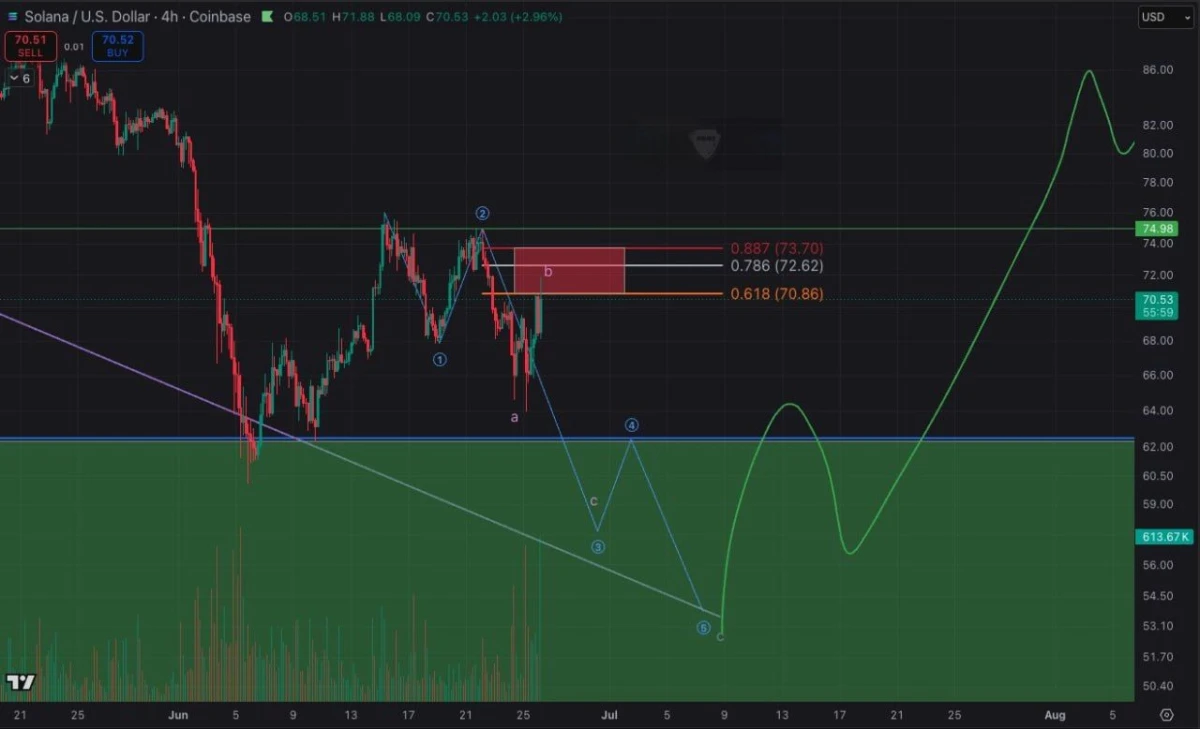
$SOL/USD 4-Hour Chart. Source: @Freedom_By_40 on X

The chart shows $SOL recovering from the early June sell-off and pushing into a short-term resistance zone between $70.86 and $73.70. A move above $74.98 would strengthen the bullish case and suggest that a faster recovery is underway.

However, the analyst’s base scenario still allows for another pullback before a larger move higher. The chart highlights a possible drop back toward the $62 support area, with deeper risk near $53 if sellers regain control.

If $SOL clears $74.98 and holds above it, the bearish pullback setup would weaken. That could open the way toward the $80-$86 range in early August.

0
0

Disclaimer: The content of this article solely reflects the author's opinion and does not represent the platform in any capacity. This article is not intended to serve as a reference for making investment decisions.

Understand the market, then trade.
Bitget offers one-stop trading for cryptocurrencies, stocks, and gold.
Trade now!

You may also like

Paramount SkyDance (PSKY.US) Nears Settlement Agreement to Advance $110 Billion Warner Acquisition, But Some State Attorneys General Still Withhold Support

According to reports, Paramount is engaged in in-depth negotiations with state attorneys general to facilitate the completion of its $110 billion acquisition of Warner Bros. Discovery; however, not all state attorneys general support this plan.

智通财经2026/09/21 02:56

More Hawkish Than Market Consensus! JPMorgan: South Korea Interest Rates Targeted at 3.75%, Terminal Rate ‘Ceiling’ Undetermined

JPMorgan believes that if semiconductor-driven growth triggers stronger inflation and credit and financial markets remain stable, its already above-market-consensus forecast for South Korea's interest rates will face upside risks.

智通财经2026/09/21 02:31

Ackman "Switches Holdings" to AI Giants: Sells All Alphabet (GOOGL.US) Shares, Increases Meta (META.US) Holdings—Should Investors Follow?

Ackman made it clear that this is not a bearish outlook on Alphabet, but rather a decision to shift funds to other, more attractive opportunities given the current valuation.

智通财经2026/09/21 01:56