
A Chart Overview of Commodity Support and Resistance: Gold, Silver, Oil, Gas + Platinum, Palladium, Copper, and Agricultural Futures (June 29, 2026)

Exchange Rate Network June 29 News —— One chart for commodity support and resistance: gold, silver, oil, gas + platinum, palladium, copper + agricultural futures, updated at 06:15 on Monday, June 29, 2026 (UTC+8), specifically covering 14 varieties including gold, silver, platinum, palladium, copper + crude oil, natural gas, fuel oil + wheat, corn, and cotton. For more details, please refer to the custom charts in Huixun Financial Analysis.
One chart for commodity support and resistance: gold, silver, oil, gas + platinum, palladium, copper + agricultural futures, updated at 06:15 on Monday, June 29, 2026 (UTC+8), specifically covering 14 varieties including gold, silver, platinum, palladium, copper + crude oil, natural gas, fuel oil + wheat, corn, and cotton. For more details, please refer to the custom charts in Huixun Financial Analysis.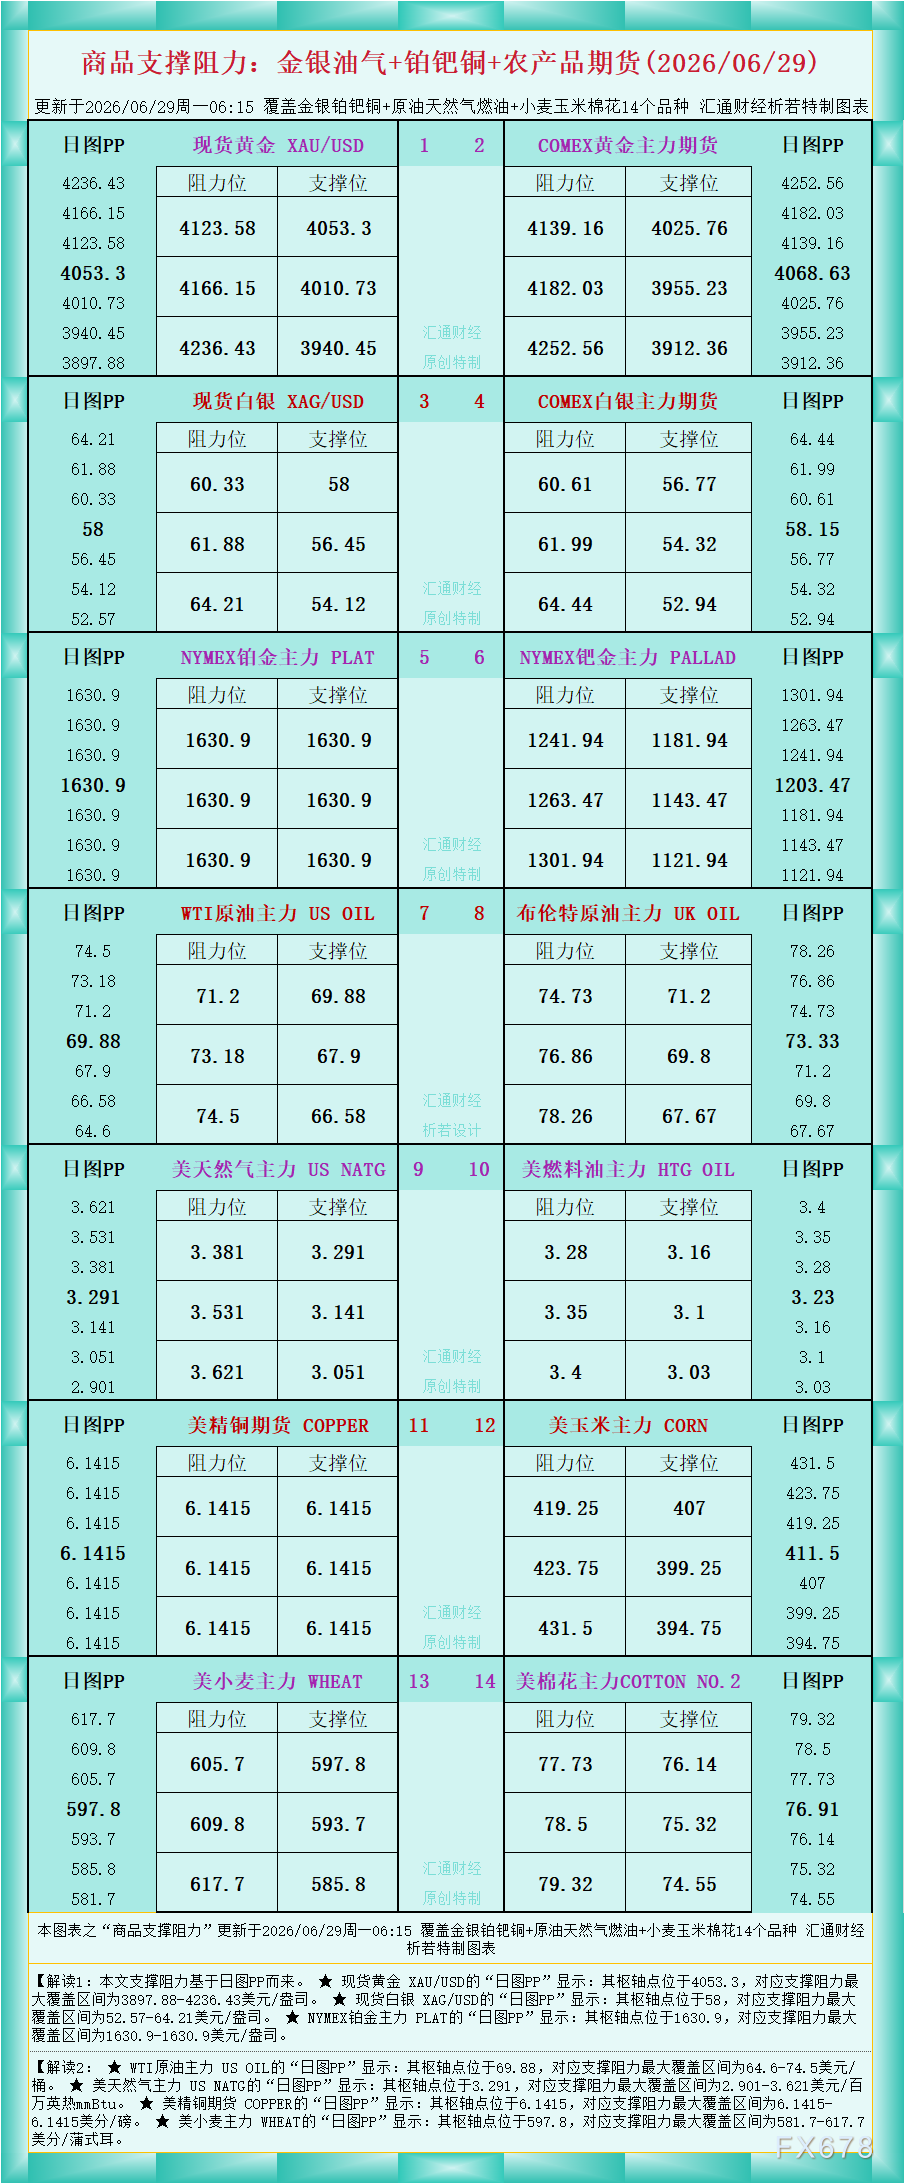
As shown in the chart, Interpretation 1: The support and resistance in this article are based on the daily PP.
★ The "daily PP" for spot gold XAU/USD shows: the pivot is at 4053.3, with the maximum support and resistance range between $3897.88–$4236.43 per ounce.
★ The "daily PP" for spot silver XAG/USD shows: the pivot is at 58, with the maximum support and resistance range between $52.57–$64.21 per ounce.
★ The "daily PP" for NYMEX platinum main contract PLAT shows: the pivot is at 1630.9, with the maximum support and resistance range between $1630.9–$1630.9 per ounce.
Interpretation 2:
★ The "daily PP" for WTI crude oil main contract US OIL shows: the pivot is at 69.88, with the maximum support and resistance range between $64.6–$74.5 per barrel.
★ The "daily PP" for US natural gas main contract US NATG shows: the pivot is at 3.291, with the maximum support and resistance range between $2.901–$3.621 per million British thermal units (mmBtu).
★ The "daily PP" for US copper futures COPPER shows: the pivot is at 6.1415, with the maximum support and resistance range between 6.1415–6.1415 cents/pound.
★ The "daily PP" for US wheat main contract WHEAT shows: the pivot is at 597.8, with the maximum support and resistance range between 581.7–617.7 cents/bushel.
For interpretations of more varieties, see the chart.
Disclaimer: The content of this article solely reflects the author's opinion and does not represent the platform in any capacity. This article is not intended to serve as a reference for making investment decisions.
You may also like
Trump’s Rate-Cut Demand Meets a New Crypto Tax Push: 5 Altcoins Worth Risking Before the Market Reprices

Nineteen out of twenty, Chair Waller again failed to deliver the Fed dot plot “assignment”
Federal Reserve Chairman Waller has twice refused to enter his interest rate forecasts on the dot plot, bluntly stating that the tool is "of no use for policy implementation." The dot plot, which has been in operation since 2011 and is published four times a year to show officials' interest rate expectations, is an important reference for the market to assess the direction of monetary policy. However, its lack of consensus, anonymity, and the participation of non-voting governors have long been criticized. Previous chairs have had varying attitudes toward the tool, but Waller's stance is the toughest.
NEAR Protocol Chain Signatures connect 30+ blockchains, skip bridges
Overnight US Stock Market | Federal Reserve Raises Interest Rates by 25 Basis Points as Expected, All Three Major Indexes Close Lower, SpaceX (SPCX.US) Rises Over 5%
At market close, the Dow Jones Industrial Average fell by 630.56 points, or 1.21%, to 51,462.55 points; the S&P 500 Index dropped 33.51 points, or 0.44%, to 7,552.22 points; and the Nasdaq Composite Index declined 3.15 points, or 0.01%, to 25,978.42 points.

Crypto prices
More


