
A Chart of Commodity Support and Resistance: Gold, Silver, Oil, Gas + Platinum, Palladium, Copper, Agricultural Futures (June 30, 2026)

FX678 June 30—— A single chart visualizing commodity support and resistance: gold, silver, oil, gas, platinum, palladium, copper, and agricultural futures, updated on Tuesday, June 30, 2026, 07:00 (UTC+8). Specifically covering 14 varieties including gold, silver, platinum, palladium, copper, crude oil, natural gas, fuel oil, wheat, corn, and cotton. For more details, refer to the FX678's custom chart.
A chart visualizing commodity support and resistance: gold, silver, oil, gas, platinum, palladium, copper, and agricultural futures, updated on Tuesday, June 30, 2026, 07:00 (UTC+8). Specifically covering 14 varieties including gold, silver, platinum, palladium, copper, crude oil, natural gas, fuel oil, wheat, corn, and cotton. For more details, see the content in the specially-made FX678 chart.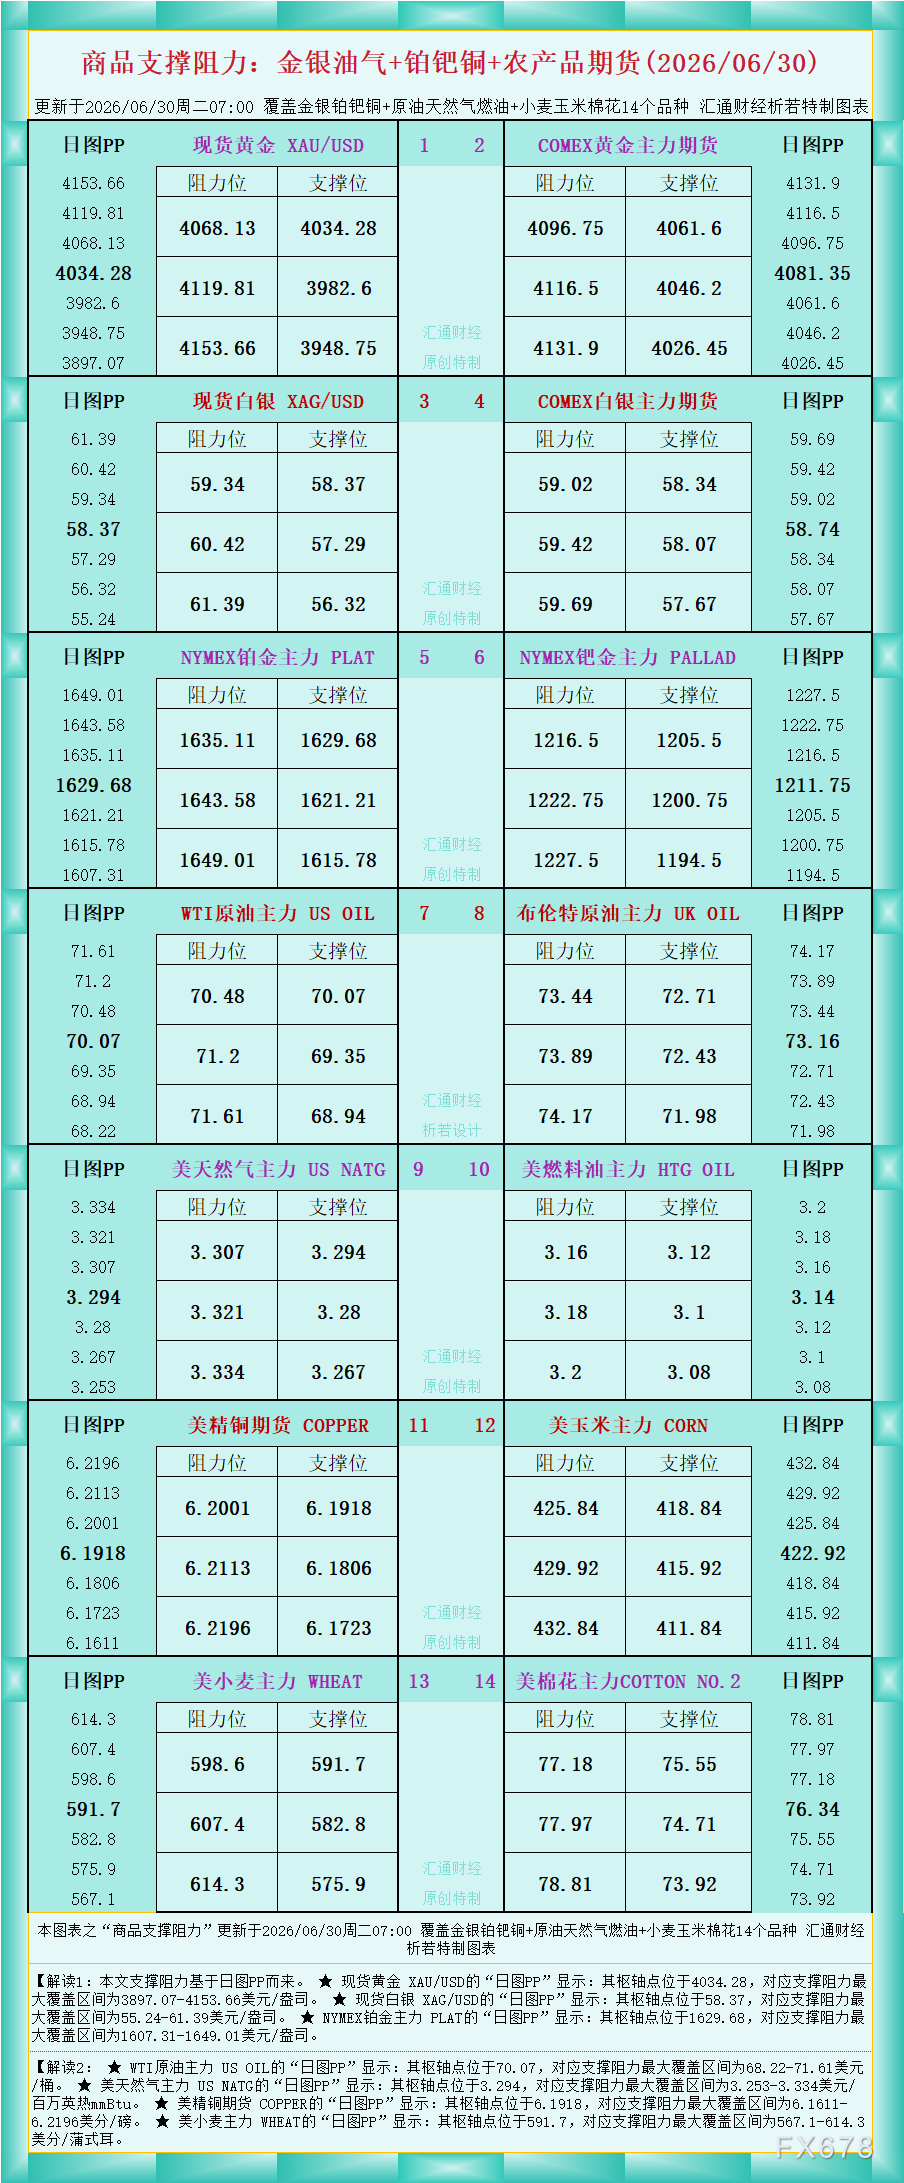
As shown in the figure, Interpretation 1: The support and resistance levels in this article are based on the daily chart pivot points (PP).
★ For spot gold XAU/USD, the “Daily Chart PP” shows: the pivot point is at 4034.28, with the maximum support and resistance range covering $3897.07-$4153.66/oz.
★ For spot silver XAG/USD, the “Daily Chart PP” shows: the pivot point is at 58.37, with the maximum support and resistance range covering $55.24-$61.39/oz.
★ For NYMEX platinum main contract PLAT, the “Daily Chart PP” shows: the pivot point is at 1629.68, with the maximum support and resistance range covering $1607.31-$1649.01/oz.
Interpretation 2:
★ For WTI Crude Oil main contract US OIL, the “Daily Chart PP” shows: the pivot point is at 70.07, with the maximum support and resistance range covering $68.22-$71.61/barrel.
★ For US natural gas main contract US NATG, the “Daily Chart PP” shows: the pivot point is at 3.294, with the maximum support and resistance range covering $3.253-$3.334/MMBtu.
★ For US copper futures COPPER, the “Daily Chart PP” shows: the pivot point is at 6.1918, with the maximum support and resistance range covering 6.1611-6.2196 cents/pound.
★ For US wheat main contract WHEAT, the “Daily Chart PP” shows: the pivot point is at 591.7, with the maximum support and resistance range covering 567.1-614.3 cents/bushel.
For more variety interpretations, refer to the chart. Produced originally and exclusively by FX678. All rights reserved.
Disclaimer: The content of this article solely reflects the author's opinion and does not represent the platform in any capacity. This article is not intended to serve as a reference for making investment decisions.
You may also like
Wall Street Sees Nifty at 30,000: Why Are Foreign Investors Still Selling Indian Stocks?
UBS: Maintains Tesla (TSLA.US) “Neutral” rating, target price $385, AI narrative dominates stock price pricing logic
UBS predicts that Tesla's global deliveries in the third quarter of 2026 (3Q26) will be approximately 470,000 vehicles, representing a year-on-year decrease of 5% and a quarter-on-quarter decrease of 1%.
Altcoin Price Targets Point to Six 2027 Levels
The AI frenzy withstands the "5% US Treasury yield"! Nasdaq hits new highs, strengthening the "80/20" pattern as Wall Street reassesses stock-bond allocation
The 30-year US Treasury yield briefly reached about 5.53%, hitting its highest level since 2004, while Brent crude remains above $100 per barrel. Risk assets have once again withstood the pressure, reflecting investors' continued belief that the commercialization of AI applications and corporate profit growth can to some extent offset the impact of rising financing costs and discount rates.
Crypto prices
More


