
SUI Price Holds $0.65 Support as Breakout Hopes Rise

- SUI Price is holding above the critical $0.65 support level.
- A breakout above $0.75 could trigger further upside toward $0.80.
- Failure to hold support may expose $0.60 and lower price levels.
SUI Price is trading near a critical long-term support zone as analysts debate whether the recent correction has finally reached its bottom. At press time, SUI traded at $0.704, up 3.28% over the past 24 hours. Although buyers have stepped in around current levels, technical analysts say confirmation of a lasting recovery is still missing.
SUI Price Tests Major Support After Deep Correction
SUI Price has reached an important support area around $0.65 after an extended decline. However, the preferred technical outlook still allows for one more lower low before a sustained recovery begins.
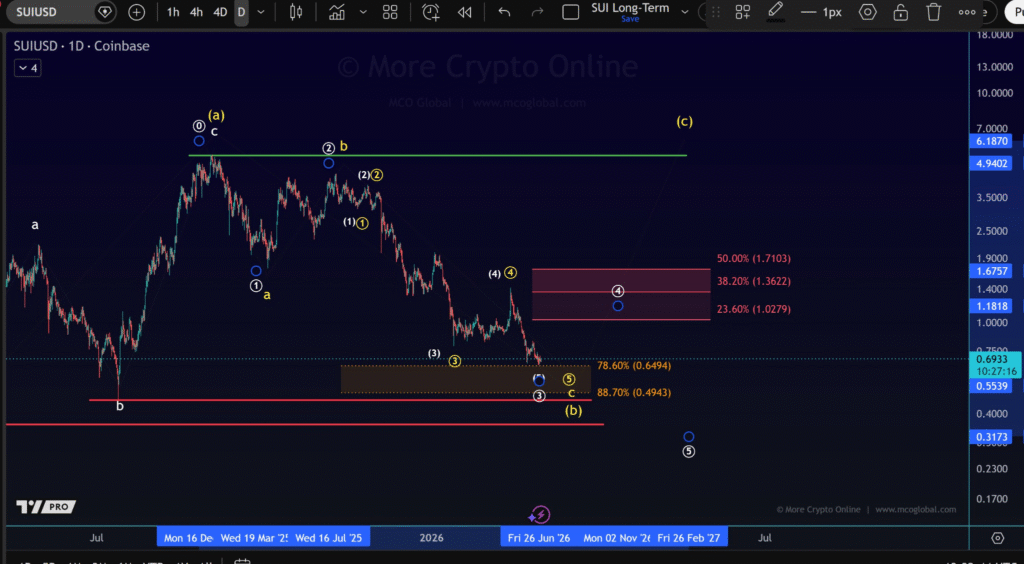
The analyst noted that confirmation would require a clear five-wave advance followed by a break above the previous swing high near $0.83. Until then, caution remains appropriate despite the recent stabilization.
If selling pressure returns, the next major support lies between $0.49 and $0.50. On the upside, a recovery rally would eventually face significant resistance between $1.20 and $1.71.
SUI Price Faces Resistance While Buyers Return
Another market analyst, BitGuru, identified the $0.67 to $0.69 range as an attractive accumulation zone after months of weakness. Trading volume has increased, suggesting buyers are becoming more active as leveraged positions unwind.
The immediate challenge for SUI Price remains the $0.72 to $0.75 resistance zone. A decisive breakout above $0.75 with strong trading volume could open the way toward $0.80, while continued buying could later target $0.84.
Technical conditions remain balanced. SUI Price continues to hold above the key $0.65 support, preserving the current bullish structure. However, a daily close below this level would invalidate the short-term recovery outlook and increase the likelihood of another decline toward $0.60.
Until price breaks above nearby resistance, traders are likely to wait for stronger confirmation before positioning for a broader trend reversal.
Disclaimer: The content of this article solely reflects the author's opinion and does not represent the platform in any capacity. This article is not intended to serve as a reference for making investment decisions.
You may also like
Long-term US Treasury Sell-off Continues! 10-Year Treasury Yield Breaks 5.2% Again, “AI Boom vs. Rising Financing Costs” Narrative Showdown Intensifies
On Monday, oil prices rose and US Treasury bonds were sold off again as former US President Donald Trump rejected Iran's latest proposal to reopen the Strait of Hormuz, heightening concerns about inflation.
Banks Have Been Earning Effortlessly from Idle Funds for Years—Will AI Agents Change Everything?
For years, banks have profited from customers' idle funds, but AI agents may be about to change this situation.
Goldman Sachs: US stocks are showing a "strong index, weak confidence" pattern; catch-up rally may become the main theme of the next phase
Goldman Sachs stated that the current U.S. stock market is showing an unusual pattern: while index performance is strong, investor confidence remains weak. This suggests that the market still has further upside potential, and stocks that previously lagged behind leading AI stocks may soon experience a catch-up rally.

U.S. Stocks Weekly Macro Preview (Sep. 28–Oct. 2)
Crypto prices
More


