thecryptobasic.com
$XRP may currently be forming a double bottom, but a bullish reversal would depend on a breach of the neckline.
$XRP has stayed under pressure for most of 2026, with prices moving mostly downward. However, recent price action between early June and early July suggests that the selling pressure may be easing.
During this period, $XRP formed what looks like a developing double bottom pattern. However, this pattern is not yet complete, and the neckline at $1.29 will likely decide whether $XRP can turn higher or continue its decline.
$XRP Sees Two Bottoms
The structure began when $XRP dropped below the $1.28 to $1.30 support range in late May. This breakdown led to the first bottom at $1.05 in early June. At that time, selling pressure was strong, with volume reaching 281.77 million $XRP on June 5 and 141.36 million $XRP on June 6.
After this drop, $XRP recovered and climbed to $1.29 by June 15, forming the neckline. However, the recovery did not last. Sellers pushed the price lower again, leading to a second bottom at $1.0092 on June 26.
This second low slightly moved below the first, which can sometimes signal a bear trap. In such cases, sellers push the price below support, but fail to keep it there.
Volume data supports this idea. Although trading volume reached 145 million $XRP on June 26, it was still lower than the heavy selling seen on June 5 and June 6. This drop in volume while price moves lower often suggests that selling pressure is weakening.
Volume Shows Partial Recovery
At the start of July, $XRP began to recover. On July 1, the price broke out of a range between $1.02 and $1.07. Since then, $XRP has recorded three straight days of gains, reaching $1.1385.
Trading activity also increased during this move. Volume rose to 87.97 million $XRP on the breakout day, up from 66 million $XRP the day before. In the days that followed, volume stayed above 84 million $XRP.
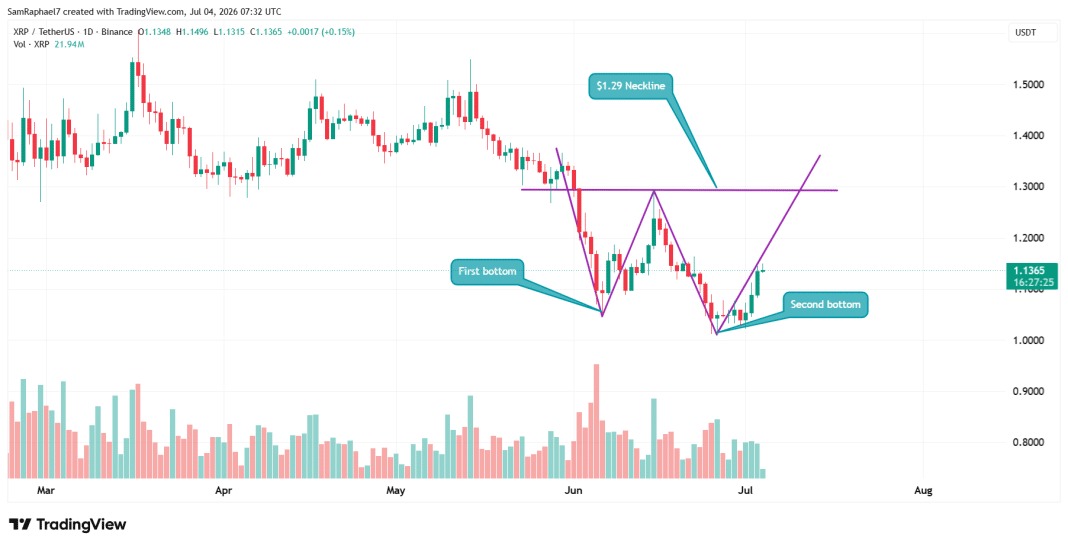 $XRP Forming Double Bottom
However, this is still much lower than the levels seen during the sharp sell-off in early June. Current volume is only about 30% of what was recorded on June 5, which means the recovery still lacks strong confirmation.
On the other hand, broader market data shows some support. $XRP spot ETFs have seen consecutive weeks of inflows, adding up to about $1.47 billion. Meanwhile, exchange outflows have increased by about 200%, rising from 40.7 million $XRP on June 22 to around 123 million $XRP.
This suggests that investors are moving their holdings off exchanges, which reduces available supply. However, this has not yet shown clearly in price momentum.
The Neckline Remains the Key Level
The most important level to watch right now is between $1.28 and $1.29, where the neckline sits. $XRP needs to close above this range and hold it to confirm the double bottom pattern. Without this move, the setup remains incomplete.
If $XRP breaks above this level, the next target stands near $1.57. This comes from adding the pattern depth of $0.28 to the neckline. This target is also close to the previous high of $1.5496 on May 14, which acted as strong resistance before the earlier drop.
Before reaching the neckline, $XRP faces several resistance levels. The 44-day moving average at $1.17 represents the first barrier, and the price is currently looking to test this area. Above that is the 0.382 Fibonacci level near $1.18.
Data on holder positions adds to these resistance zones. Around 22.8 million $XRP is concentrated between $1.18 and $1.19, while another 27.4 million $XRP sits between $1.21 and $1.22. These levels could attract selling as investors try to exit at break-even.
Even with this developing pattern, $XRP is still in a larger downtrend that started after its 2025 peak above $3.50. This means the current setup is still a possible reversal within a bearish trend.