


As of September 25, 2026, TRUMPUSDT trades near $2.10, locked in a range that signals an approaching breakout. The Trump crypto market faces over 50 federal prosecutors criticizing a financial arrangement tied to Donald Trump. The calm chart masks headline risk that could spike volatility at any moment.
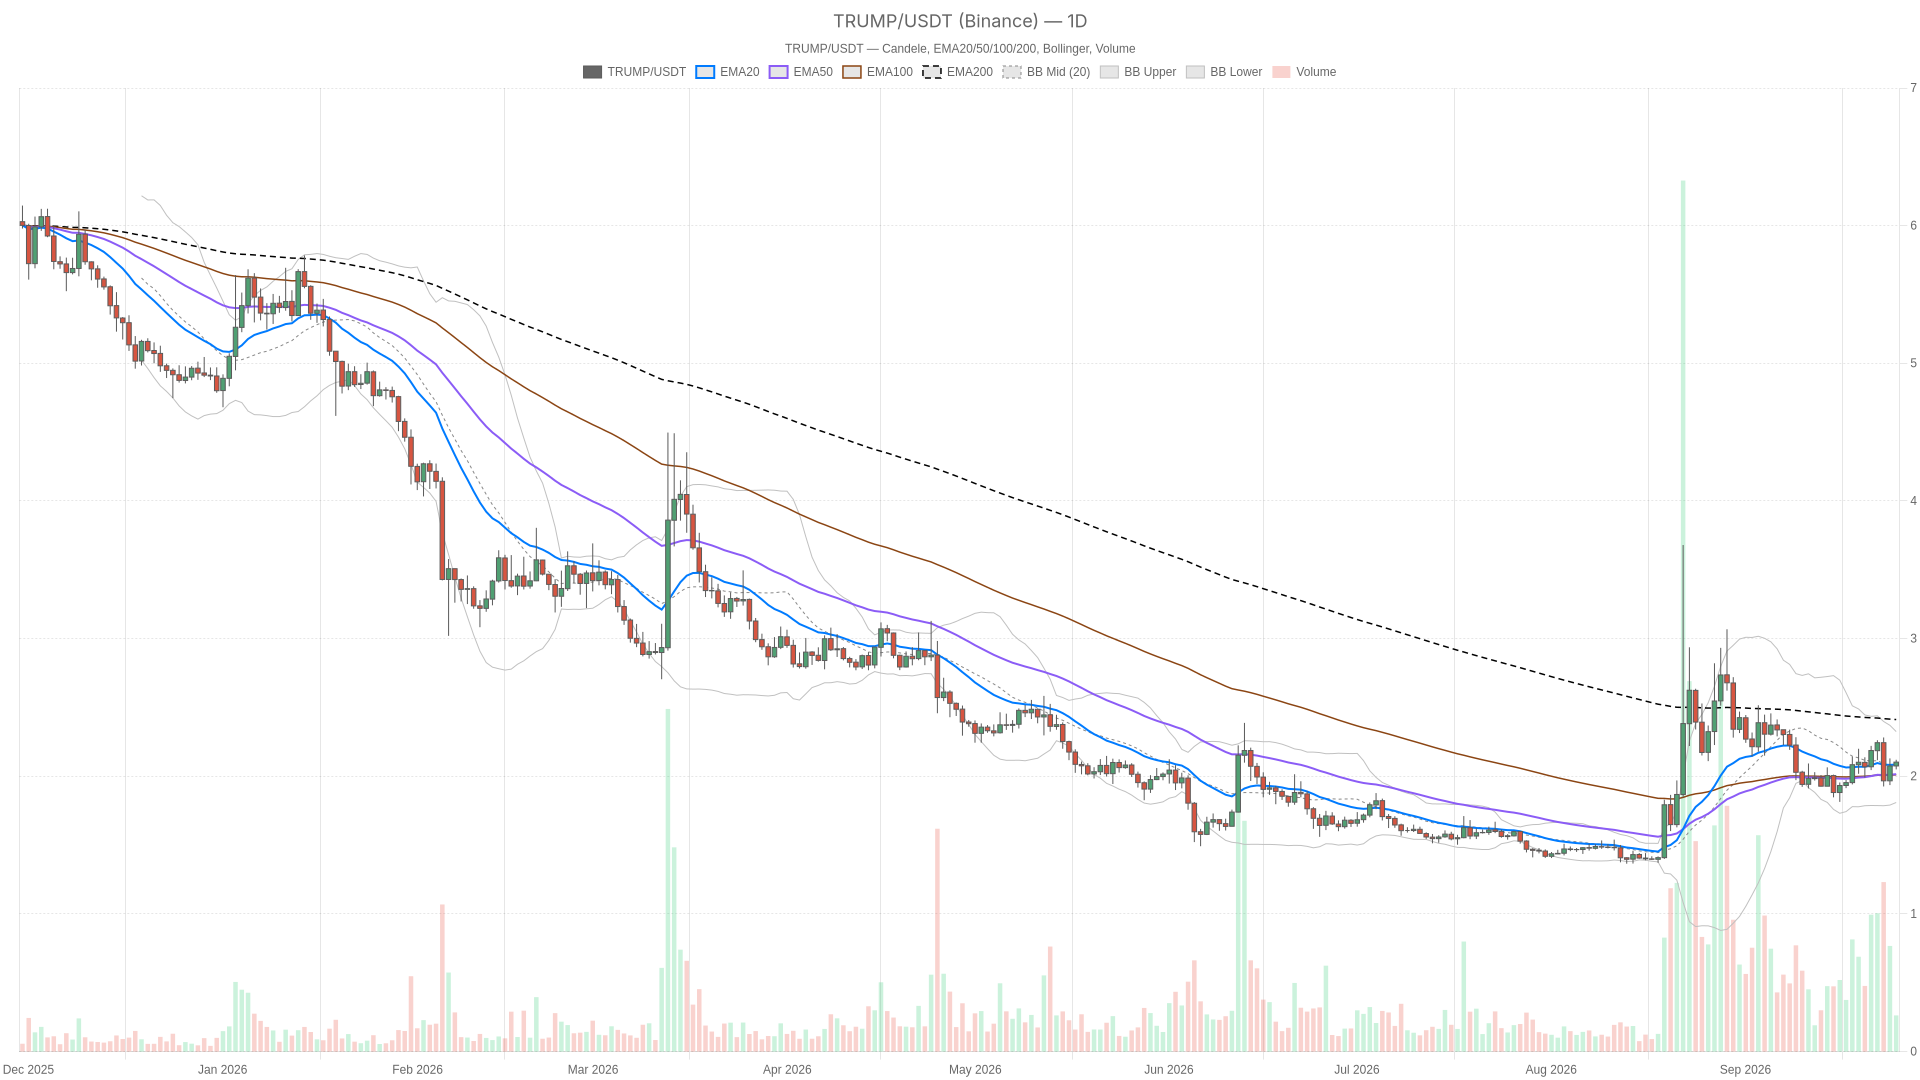 $TRUMP/USDT — daily chart with candlesticks, EMA20/EMA50 and volume.
Key takeaways
- TRUMPUSDT hovers at $2.10, pinned between daily support at $2.06 and resistance at $2.13.
- The daily chart remains neutral, with RSI at 51.09 and MACD flat, signaling no directional conviction.
- Price sits well below the 200 EMA at $2.41, keeping the longer-term trend bearish.
- Over 50 federal prosecutors have criticized a Trump-linked financial arrangement, according to Fortune.
- The Fear & Greed Index reads 71 (Greed) despite a red day for total crypto market cap.
Daily Chart: Neutral Regime, But the 200 EMA Tells a Story
The daily chart shows a market still repairing itself after a larger drawdown rather than building a fresh uptrend. Price closed at $2.10, just above the 20-period EMA at $2.08 and the 50-period EMA at $2.02. However, the 200-period EMA sits at $2.41. This means the broader trend that governed this asset over the past several months still points lower relative to where price trades today.
RSI14 on the daily is 51.09, dead center, with no momentum bias in either direction. MACD is essentially flat, with line, signal and histogram all reading 0. That confirms there is no directional conviction building on this timeframe. When RSI is neutral and MACD is flat simultaneously, the market is typically waiting for a catalyst rather than actively deciding anything.
Bollinger Bands on the daily are wide, with the mid at $2.07, upper at $2.32, and lower at $1.81. This reflects the volatility of the prior move down. Price parked near the midline suggests consolidation rather than a fresh breakout attempt. Daily ATR14 of $0.15 remains a meaningful chunk of the current price, so this quiet stretch should not be mistaken for genuinely low volatility. The daily pivot cluster frames the immediate battleground at pivot $2.09, resistance $2.13, and support $2.06.
1H and 15M: Short-Term Strength Without Bigger Picture Confirmation
Shorter timeframes show bullish momentum emerging, but this strength has not yet been validated by the daily structure. On the hourly chart, the regime flips to bullish, RSI14 climbs to 59.73, and MACD nudges into slightly positive territory. The 20, 50 and 200 EMAs on the 1H are essentially stacked together around $2.07. This tells you the bullish read is fresh and untested rather than a well-established trend.
The 15-minute chart echoes that same bullish lean, with RSI14 at 61.11 and MACD marginally positive. That said, the Bollinger Bands here are notably narrow, spanning $2.05 to $2.11. Meanwhile, the 15-minute pivot, resistance and support are compressed into a $2.10 to $2.11 band. This says the market is coiling tightly right under resistance, not that a breakout has actually happened. The disagreement between timeframes is the key tension: intraday charts are constructive, but the daily structure has not confirmed anything beyond neutral.
Sentiment and Market Context
The broader market backdrop adds another layer of caution. Total crypto market capitalization sits at roughly $2.88 trillion, down 1.35% over the past 24 hours, according to CoinGecko data. Bitcoin dominance is elevated at 58.8%, which matters for an asset like TRUMPUSDT. When capital concentrates this heavily in $BTC, altcoins tend to receive less of the rotation flow needed to sustain independent rallies.
Meanwhile, the Fear & Greed Index reads 71, firmly in Greed territory. That sits awkwardly next to a red day for total market cap. The mismatch between greedy positioning and a down day is the kind of setup that has preceded short, sharp pullbacks before. Moreover, on-chain activity elsewhere is mixed: DEX fee data shows Uniswap V3 and V4 fees climbing double digits over the past week, while Curve DEX fees dropped sharply, down over 75% on a 7-day basis. Liquidity is rotating unevenly rather than lifting everything at once.
Bullish Scenario
A breakout above $2.13 would open the door toward the upper Bollinger band at $2.32, which lines up close to the 200 EMA at $2.41. Reclaiming that zone would be the first real sign that the longer-term downtrend is being challenged rather than just paused. For this to have legs, RSI on the daily would need to break clearly above 55-60 and MACD would need to turn positive rather than sitting flat. This scenario is invalidated by a rejection back below the $2.08 EMA20/H1 support zone, which would suggest the intraday bullish regime was just noise inside a still-neutral daily range.
Bearish Scenario
The bear case leans on price remaining well below the daily 200 EMA and on Greed-level sentiment paired with a falling total market cap. That combination is fragile. A loss of daily support at $2.06, followed by a break of the 50 EMA at $2.02, would open the path back toward the lower Bollinger band around $1.81. That would essentially retest the zone this asset bounced from. This scenario gains strength if $BTC dominance keeps climbing, since that typically starves altcoins of the flows needed to hold gains. A daily close back above $2.13 that holds would invalidate the bearish case.
Positioning and Risk
Right now TRUMPUSDT is a market with conflicting timeframes. Short-term charts lean bullish, the daily remains neutral, and the longer-term trend has not been repaired. That is not a comfortable setup for conviction in either direction. For anyone tracking Trump crypto assets, the current calm should be treated as temporary rather than settled. Both the bullish and bearish paths remain very much live, and expectations should be sized accordingly.
Daily ATR of $0.15 means moves can happen fast once a level breaks. Consequently, the $2.06 to $2.13 range is not just a technical curiosity. It is the zone that will likely decide which scenario plays out next. Add in the political headlines swirling around Trump’s trading disclosures, and it is reasonable to expect volatility spikes that have little to do with the charts themselves.
FAQ
What is the current price of TRUMPUSDT?
As of September 25, 2026, TRUMPUSDT is trading around $2.10, sitting almost exactly on its daily pivot of $2.09. The price has been consolidating in a tight range between support at $2.06 and resistance at $2.13.
Is TRUMPUSDT in a bullish or bearish trend?
The short-term hourly chart shows a bullish lean, but the daily timeframe remains neutral. Price remains well below the 200 EMA at $2.41, meaning the broader multi-month trend is still bearish. The conflicting signals across timeframes suggest the market is waiting for a catalyst before picking a direction.
What are the key levels to watch for TRUMPUSDT?
The immediate range is defined by daily support at $2.06 and resistance at $2.13. A break above resistance opens the path toward $2.32 and the 200 EMA at $2.41. A breakdown below support targets the lower Bollinger band near $1.81.
What political factors are currently affecting TRUMPUSDT?
Over 50 federal prosecutors have publicly criticized a $100,000-a-month financial arrangement tied to Donald Trump, according to Fortune. CNBC separately reported a financial disclosure showing roughly 1,100 trades in July, including Microsoft and Amazon sales. These headlines create risk that can spike volatility around Trump-linked assets.
Article produced with the assistance of artificial intelligence and reviewed by the editorial team.


