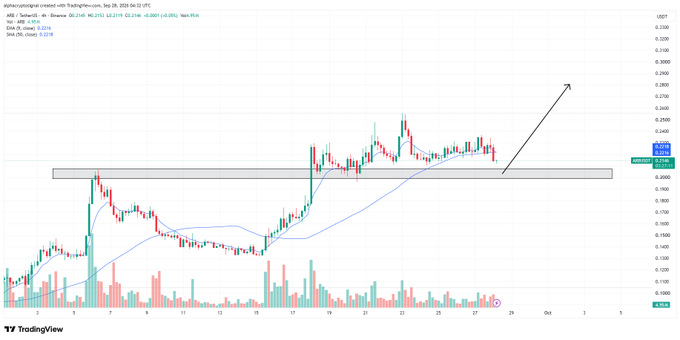
- ARB has retreated from the $0.23 area, putting the former breakout zone under renewed pressure today.
- The rising channel remains important, while higher volume during the decline signals stronger participation from sellers.
- The $0.20 area remains a key reference, with any recovery needing stronger price acceptance above nearby resistance zones.
ARB price is testing support after a sharp advance, while traders monitor momentum, volume, and the rising channel for signs of another directional move.
Pullback Brings the Former Breakout Zone Into Focus
The chart shows ARB rising sharply from the 0.13-0.15 region. That extended sideways phase preceded a strong breakout around mid-September. Price then pushed through $0.20 before approaching the $0.25 area.
The rally created a sequence of higher highs and higher lows. That structure remained intact until the recent decline gathered pace. Price is now returning toward the earlier breakout region.
The grey support zone sits beneath the latest consolidation range. It overlaps the area where previous resistance turned into support. That makes the zone important for the current technical structure.
Selling Pressure Has Increased Across the Latest Sessions
The chart shows repeated rejection near the 0.23-0.24 region. Each rebound became weaker before another downward move developed. That sequence created several lower highs across the latest price action.
The intraday chart shows ARB near $0.2087, down 8.8%. Its displayed 24-hour volume reaches roughly $379 million. Market capitalization sits near $1.41 billion in the supplied snapshot.
Higher volume during the decline gives the pullback additional weight. However, volume alone cannot confirm a full trend reversal. Price behavior around support remains the more important technical signal.
Channel Structure Keeps the Broader Recovery Visible
The rising channel remains visible across the main chart. Its lower boundary currently approaches the horizontal support area. That convergence creates a closely watched technical zone.
A bullish reaction would require strong rejection of lower prices. Higher volume on a rebound would provide additional confirmation. Without that response, the support test remains unresolved.
The $0.20 level also remains a clear psychological reference. Holding that area could allow another recovery toward nearby resistance. A sustained break below could weaken the recent breakout structure.
The chart projects a move toward roughly 0.28-0.30 if support holds. That projection depends on reclaiming the consolidation highs first. For now, ARB remains caught between support and renewed selling pressure.